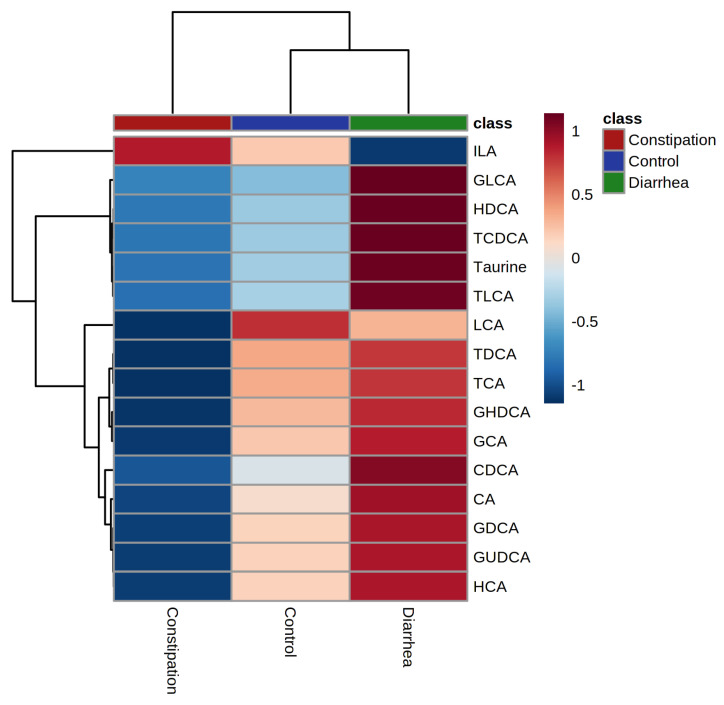
Figure 6.
Hierarchical clustering analysis for average values of groups healthy control, constipation (FC + IBS-C) group, and diarrhea (FD + IBS-D) group. Data presented as z score of logged values of µg/mg. Color ribbon beneath upper dendrogram identifies group; healthy control—blue, constipation phenotype—red, diarrhea phenotype—green. Constipation group is defined as individuals with both functional constipation and IBS-C. Diarrhea group is defined as individuals with both functional diarrhea and IBS-D.

