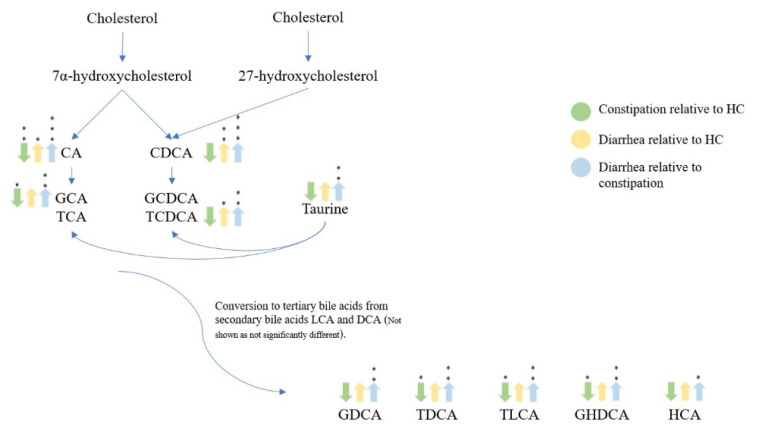
Figure 7.
Bile acid pathway visualization showing significant increased or decreased concentrations in fecal samples for healthy control, constipation (FC + IBS-C), and diarrhea (FD + IBS-D) groups. Arrows depict whether the concentration is either up or down relative to the described color in the legend. Statistical significance denoted as p < 0.05 (*), p < 0.01 (**), p < 0.001 (***). Abbreviation: deoxycholic acid (DCA).

