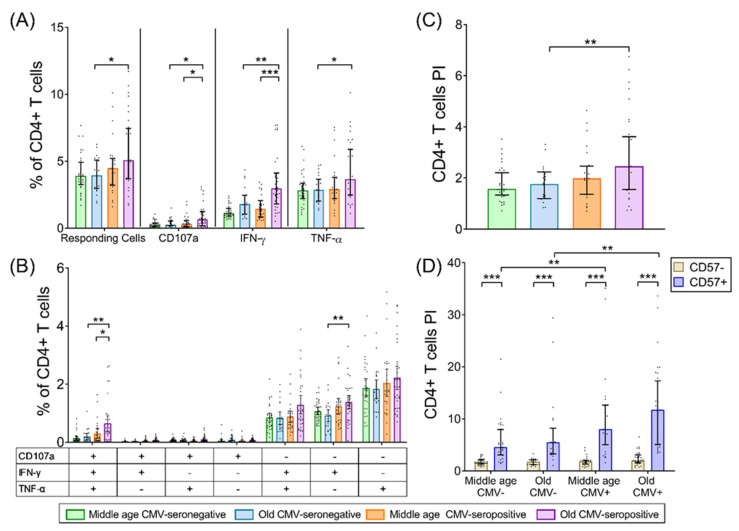
Figure 1.
CD4+ T-cell response to SEB stimulation in healthy individuals stratified by CMV serostatus and age. (A) Percentage of CD4+ T-cells that have any studied response to SEB, either total degranulation (CD107a) or the production of either of the cytokines, IFN-γ or TNF-α. (B) Graph shows the Boolean analysis result of SEB-induced responses (CD107a, IFN-γ and/or TNF-α). Scatter graphs show the magnitude of SEB responses in each functional category expressed as percentage of CD4+ T-cells. The combination of functions studied is indicated in the table below the scatter graphs. (C) The polyfunctionality index (PI) of CD4+ T-cells in response to SEB. (D) PI of CD4+ T-cells according to CD57 expression. Horizontal black lines indicate interquartile ranges, ranging from the 25th to the 75th percentile. The median for SEB-induced CD4+ T-cell responses is indicated by the bars’ upper limit. Results were considered significant at * p < 0.05, ** p < 0.01, and *** p < 0.001.

