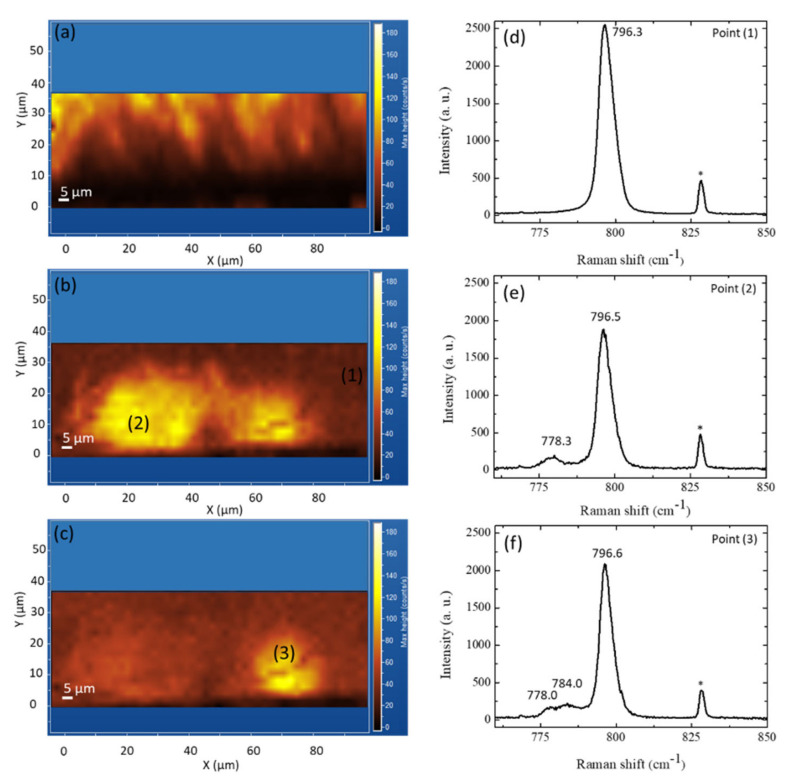
Figure 14.
Micro-PL mapping (a) at 540 nm and micro-Raman mapping of a 3C-SiC cross-section located at (b) 778 cm−1 and (c) 784 cm−1.The interface with the removed Si substrate is shown by point 0 on the Y-axis. Average Raman spectra achieved in the (d) area (1) of the map (b), (e) zone (2) of the map (b), and (f) zone (3) of the map (b,c). The laser probe created the peak located at 828.37 cm−1 (*) (see Reference [61]).

