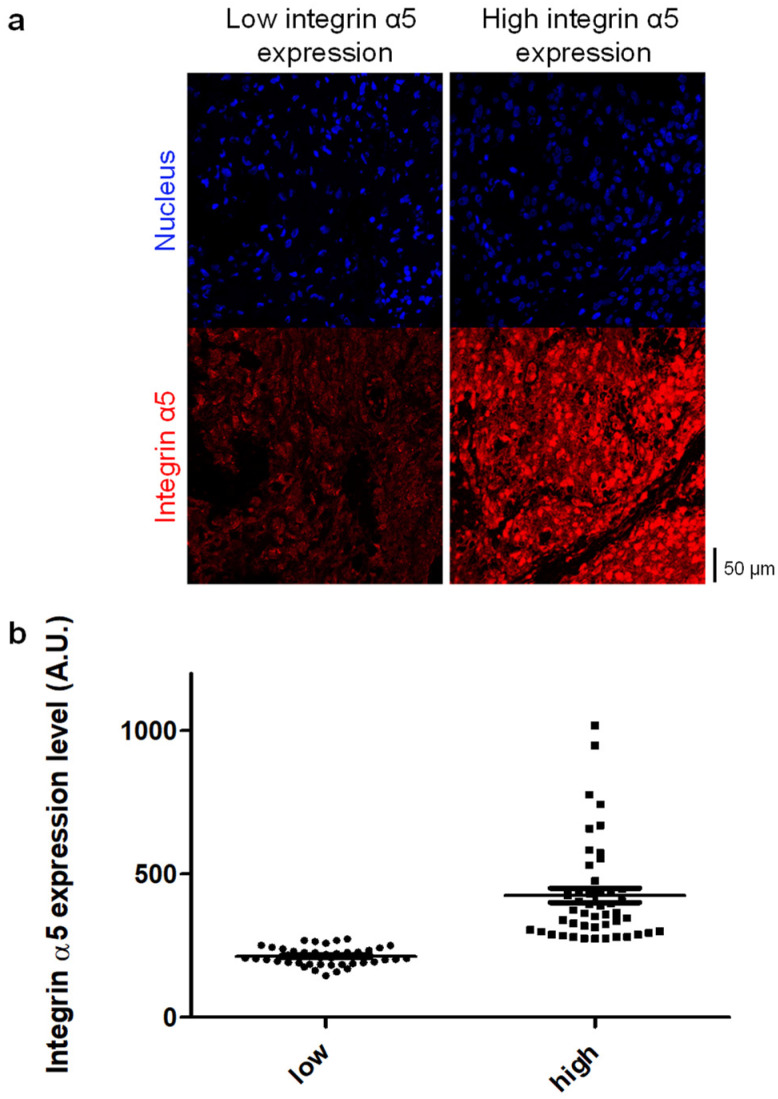
Figure 3.
Quantification of integrin α5 protein expression level in glioblastoma. (a) Representative cases of low and high integrin α5 immunostaining (magnification ×40) and (b) distribution of cumulative data for integrin α5 expression level (MMFI expressed as arbitrary units/A.U.) in glioblastoma samples. The median of MMFI of the all cohort (275 A.U.) was used as a cut-off to distinguish 2 groups characterized by low and high integrin α5 expression levels.

