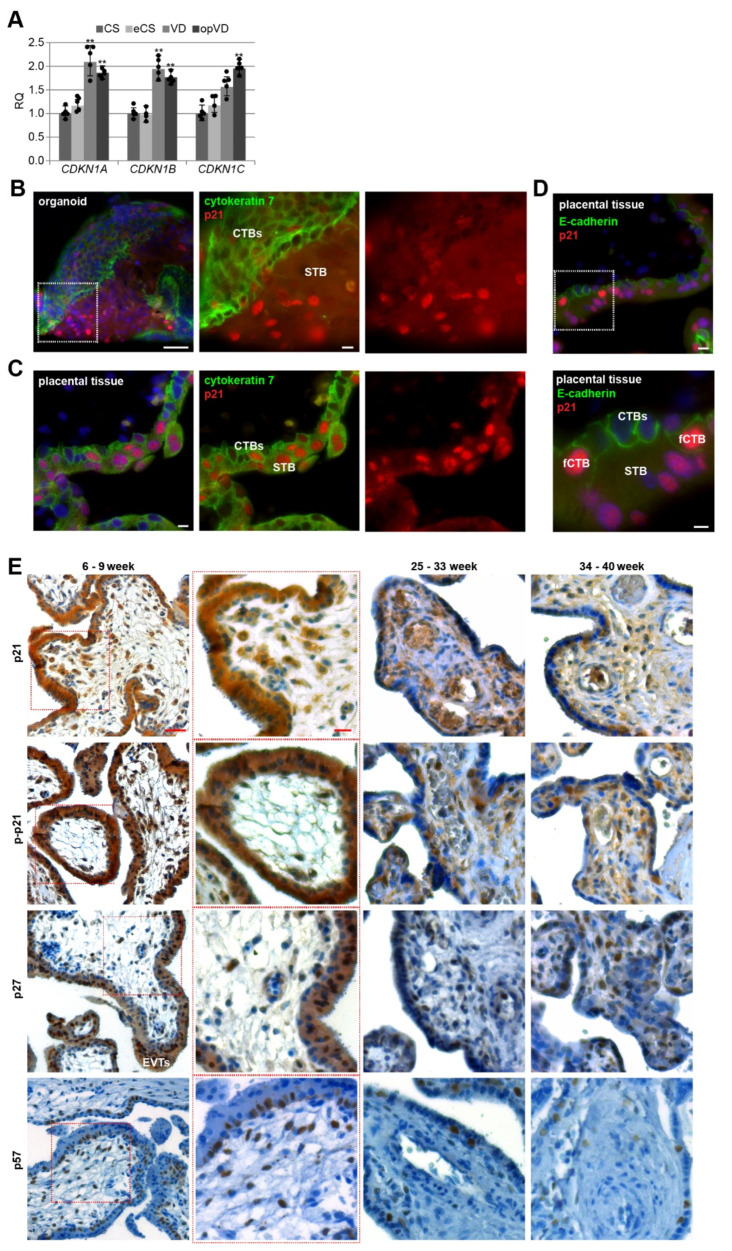
Figure 1.
Cell cycle regulators are affected by the delivery mode, and expressed in trophoblast organoids and placental tissues. (A) The relative amount of the gene levels of CDKN1A (p21), CDKN1B (p27), and CDKN1C (p57) was analyzed in placental tissues from different delivery modes (n = 5). The results are presented as relative quantification (RQ) with minimum and maximum range. The mean value of the expression levels of SDHA (succinate dehydrogenase complex, subunit A), TBP (TATA box–binding protein), and YWHAZ (tyrosine 3–monooxygenase/tryptophan 5–monooxygenase activation protein, zeta polypeptide) served as the endogenous control. CS, caesarean section; eCS, emergency caesarean section after the onset of labor; VD, vaginal delivery; opVD, operative vaginal delivery. Unpaired Student’s t-test was used for statistical analysis, ** p < 0.01. (B) Representative immunohistochemistry-immunofluorescence (IHC–IF) image of a trophoblast organoid (8 weeks of gestation) stained for cytokeratin 7 (green), p21 (red), and nuclei (DAPI, blue) is shown. Scale: 50 µm. Inset scale: 10 µm. Villous cytotrophoblasts (CTBs) and the syncytiotrophoblast (STB) are indicated. (C) Representative IHC-IF image of placental tissue (8 weeks of gestation) stained for cytokeratin 7 (green), p21 (red), and nuclei (DAPI, blue) is presented. Scale: 10 µm. (D) Representative IHC–IF image of placental tissue (7 weeks of gestation) stained for E-cadherin (green), p21 (red), and nuclei (DAPI, blue) is shown. Scale: 10 µm. Inset scale: 5 µm. CTBs ongoing to fuse to the STB (fCTBs), CTBs and the STB are indicated. (E) Formalin-fixed and paraffin-embedded (FFPE) tissue sections were immunohistochemically stained with p21 (first row), p–p21 (second row), p27 (third row) or p57 (fourth row) antibody (brown), respectively, and counterstained with hematoxylin (blue). Scale: 50 µm. Inset scale: 20 µm. EVTs (extravillous cytotrophoblasts) are indicated.

