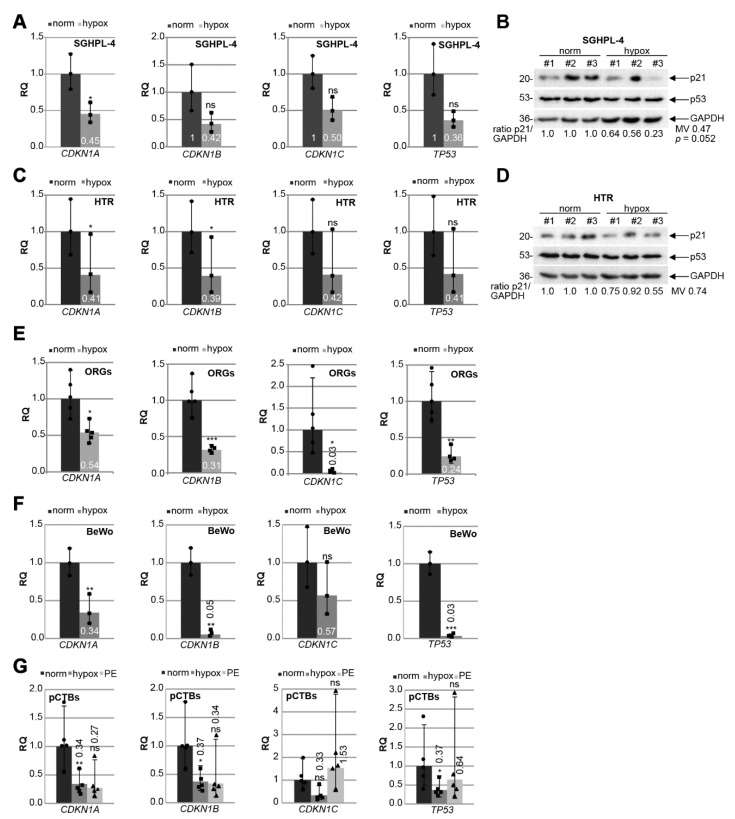
Figure 5.
p21 expression is decreased in trophoblastic cell lines and in isolated primary trophoblasts under hypoxic conditions. Cells were grown under normoxia (norm, 21.4% O2) or hypoxia (hypox, 1% O2) for 48 h prior to RNA extraction or western blot analysis. (A) SGHPL-4 cells. Gene analysis of CDKN1A (p21), CDKN1B (p27), CDKN1C (p57) and TP53 (p53) is shown. The results (n = 3) are presented as relative quantification (RQ) with minimum and maximum range. GAPDH was used as the endogenous control. (B) Western blot analysis with cellular lysates from SGHPL-4 cells (n = 3). GAPDH served as the loading control. (C) HTR cells. Gene analysis of CDKN1A (p21), CDKN1B (p27), CDKN1C (p57), and TP53 (p53) is shown. The results (n = 3) are presented as relative quantification (RQ) with minimum and maximum range. GAPDH was used as the endogenous control. (D) Western blot analysis with cellular lysates from HTR cells (n = 3). GAPDH served as the loading control. (E) Organoids (ORGs) cultured under normoxia (norm; n = 5) or hypoxia (hypox; n = 4). Relative gene levels of CDKN1A (p21), CDKN1B (p27), CDKN1C (p57), and TP53 (p53) are shown. The results are presented as relative quantification (RQ) with minimum and maximum range. GAPDH was used as endogenous control. (F) BeWo cells. Relative gene levels of CDKN1A (p21), CDKN1B (p27), CDKN1C (p57), and TP53 (p53) are shown. The results (n = 3) are presented as the relative quantification (RQ) with minimum and maximum range. GAPDH was used as the endogenous control. (G) Primary trophoblasts (pCTB) were isolated from healthy and preeclamptic (PE) donors. pCTBs from healthy donors were cultured under normoxia (norm; dot) or hypoxia (hypox, square), PE (triangle) pCTBs were grown under normoxia. The gene level of CDKN1A (p21), CDKN1B (p27), CDKN1C (p57), and TP53 (p53) was evaluated (n = 5). GAPDH was used as the housekeeping gene control. Student’s t-test, * p < 0.05, ** p < 0.01, *** p < 0.001. ns, not significant; MV, mean value.

