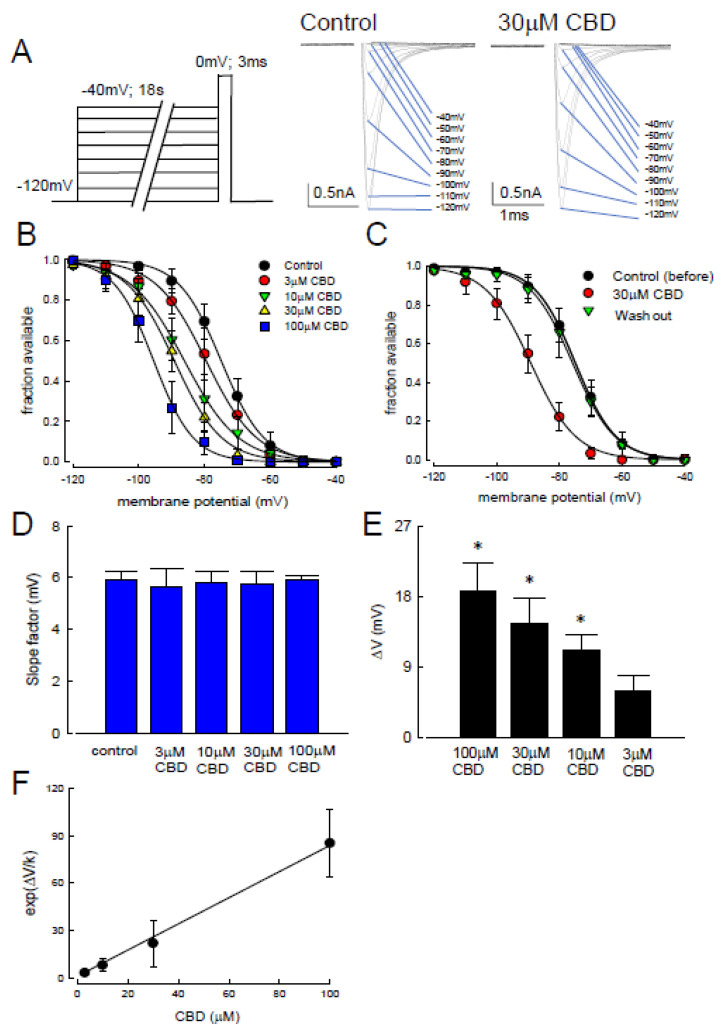
Figure 3.
Changes in the slow-inactivating curve after the applications of cannabidiol. (A) The experiment protocols were similar to those of Figure 2, however, the duration of inactivation pulse was protracted to 18 s (left panel). The representative current sweeps for slow-inactivation of Nav1.4 in the control channels and those treated with 30 µM of CBD were recorded after the short test pulse (right panel). (B) The inactivating curve was shifted left in a dose-dependent manner after treatment with different concentrations of CBD. No significant change in slope was found in these curves. Lines of best fit were fitted using the Boltzmann function 1/(1 + exp[(V − Vh)]/k), where Vh were −74.9 ± 0.4, −79.5 ± 0.6, −83.1 ± 0.5, −89.2 ± 0.6, and −95.5 ± 0.4 mV, and k values were −6.5 ± 0.3, −7.6 ± 0.5, −8.4 ± 0.4, −7.2 ± 0.4, and −6.0 ± 0.3 for the control channels and those channels treated with 3, 10, 30, and 100 μM of CBD, respectively. (C) The inactivation curves in the control channels, those treated with 30 μM of CBD, and those after washing out. There was a hyperpolarized shift of the inactivation curve in those channels upon treatment with 30 µM of CBD. Lines are fit using the Boltzmann function 1/(1 + exp [(V − Vh)]/k), where Vh were −7.4 ± 0.4, −89.2 ± 0.6, and −75.9 ± 0.5 mV, and k values were −6.5 ± 0.3, −7.2 ± 0.45, and −6.8 ± 0.37 for the control channels, those with 30 μM CBD, and the washing out channels, respectively. (D) CBD did not significantly change the slope factor k. Cumulative results showed that the average values in the control channels and those channels after treatment with 3, 10, 30, and 100 μM of CBD were 5.8 ± 0.3, 5.6 ± 0.7, 5.8 ± 0.4, 5.7 ± 0.5, and 5.9 ± 0.1, respectively. (E) A dose-dependent shift in Vh for the inactivation curve. Comparing to the controls, the degree of voltage shift was 5.9 ± 1.9, 11.1 ± 1.9, 14.5 ± 3.3, and 18.7 ± 3.6 mV for those channels after treatment with 3, 10, 30, and 100 μM of CBD, respectively, (*, p < 0.05). (F) The exp(ΔV/k) values are plotted against the concentration of CBD. ΔV/k were derived from mean values Figure 3D,E. The line is a best fit to the data of the formula exp(ΔV/k) = 1 + ([CBD]/1.3), where the y-intercept is 1. The [CBD] denotes the CBD concentration in μM [42,43,44].

