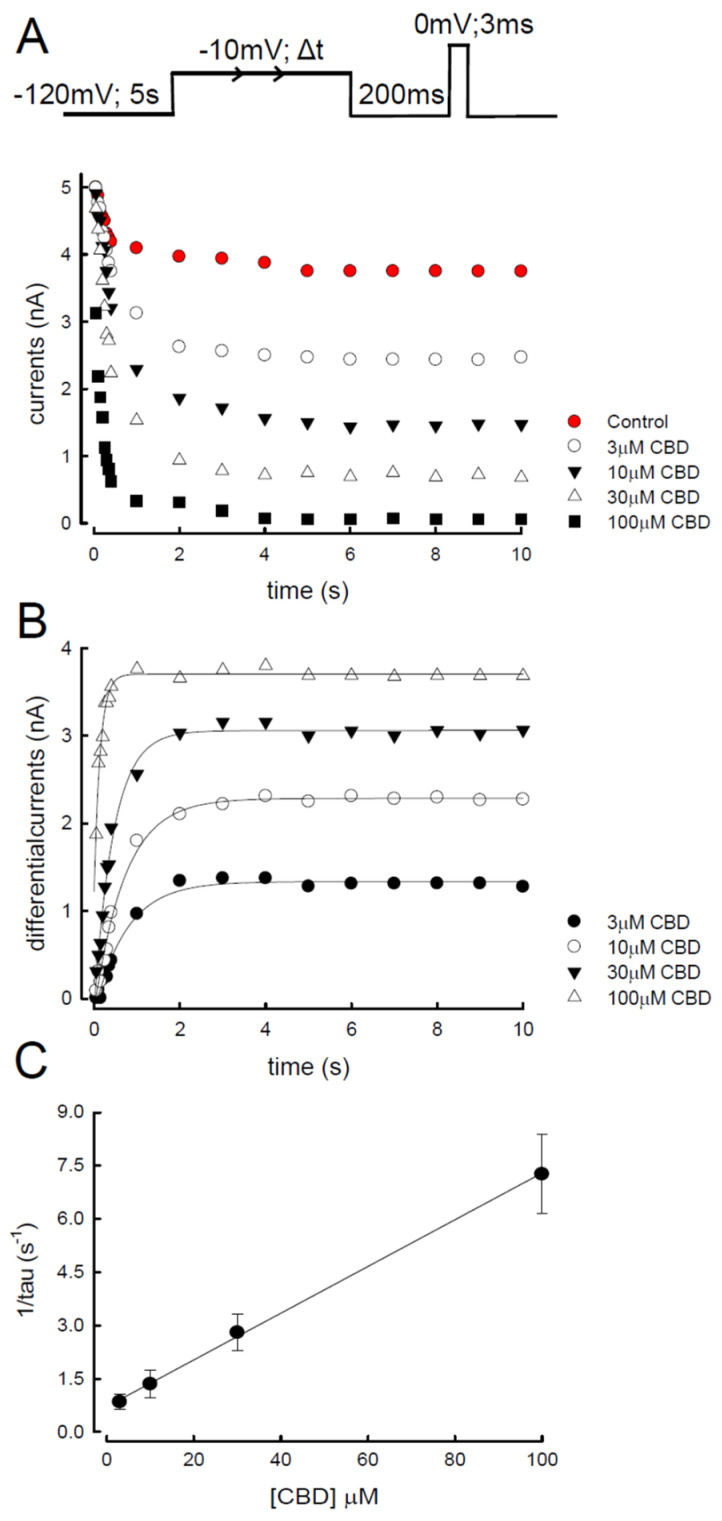
Figure 6.
Binding rate of cannabidiol to the slow-inactivated Nav1.4 channel. (A) Patched cells were held at −120 mV for 5 s and stepped to an inactivating pulse at −10 mV for various durations of time (0.05, 0.1, 0.15, 0.2, 0.25, 0.3, 0.35, 0.4, 1, 2, 4, 5, 6, 7, 8, 9, and 10 s). The cells were then subjected to a fixed gap at −120 mV for 200 ms, which was set to allow for partial recovery of the slow-inactivated channels to obtain measurable currents elicited by the subsequent test pulse at 0 mV. Elicited currents were plotted against the duration of the inactivating pulse (−10 mV), and the representative currents were overlaid according to the time sequence. (B) Differential currents between the CBD and control conditions. Data were obtained from Figure 6A and are plotted against the duration of the prepulse. The time constants from the fit were 801.3, 740.2, 454.5, and 138.7 ms for the different CBD concentrations, namely, 3, 10, 30, and 100 μM, respectively. (C) The reciprocal of the time constant from that fitted in Figure 6B is plotted against the concentrations of CBD. The slope of the solid line is 64,000 M−1 s−1, and the y-intercept is 0.7 s−1.

