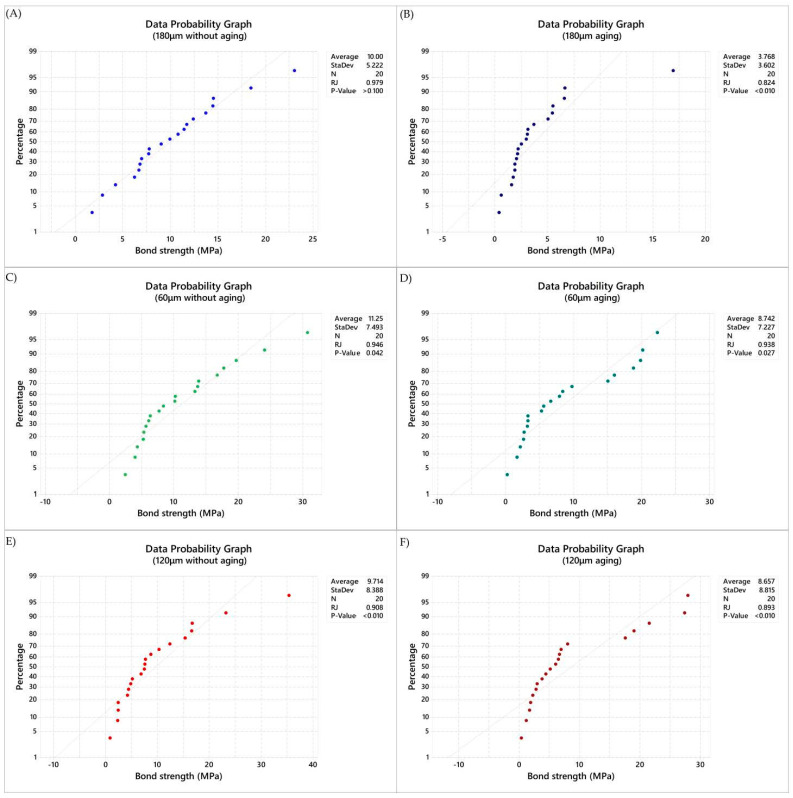
Figure 2.
Normality data plot (Ryan–Joiner) applied in the present study. (A) Data probability graph in immediate tested samples with 180 μm of cement layer thickness, (B) Data probability graph in aged samples with 180 μm of cement layer thickness, (C) Data probability graph in immediate tested samples with 120 μm of cement layer thickness, (D) Data probability graph in aged samples with 120 μm of cement layer thickness, (E) Data probability graph in immediate tested samples with 60 μm of cement layer thickness, (F) Data probability graph in aged samples with 60 μm of cement layer thickness.

