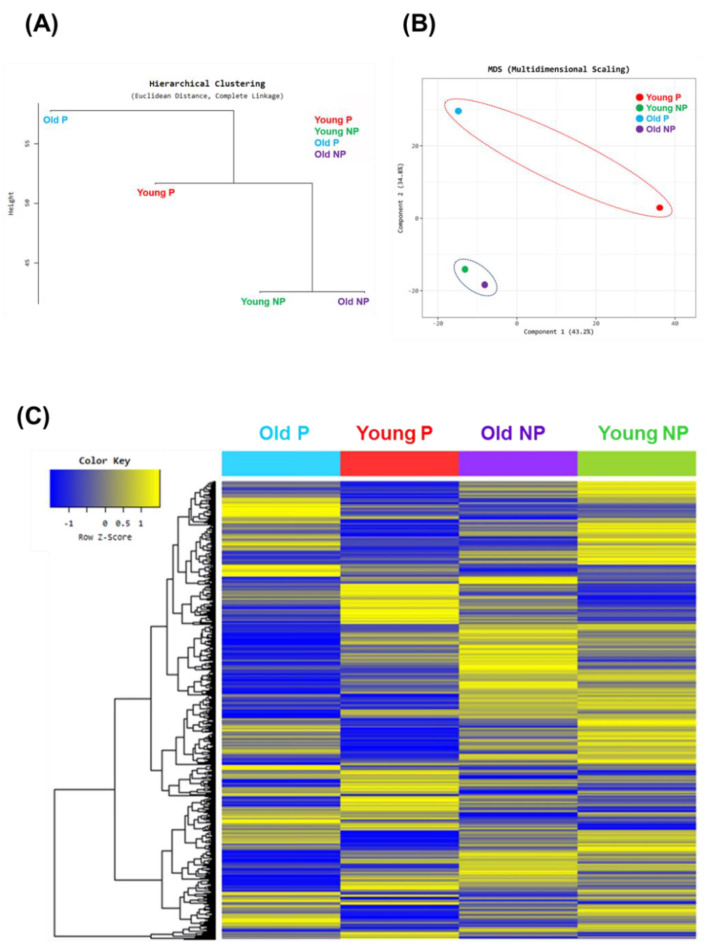
Figure 1.
Graphs of Euclidean distance, multidimensional scaling analysis, and hierarchical clustering heatmap analysis. Hierarchical clustering by (A) Euclidean distance and (B) multidimensional scaling (MDS), comparing age and pregnancy: young pregnancy (Young P, red), young non-pregnancy (Young NP, green), old pregnancy (Old P, blue), old non-pregnancy (Old NP, purple). (C) Graph of hierarchical clustering heatmap indicating differentially up- and downregulated genes based on age and pregnancy outcome. Color intensity indicates gene expression, normalized using log2(FPKM) values. Yellow and blue indicate up- and downregulation, respectively.

