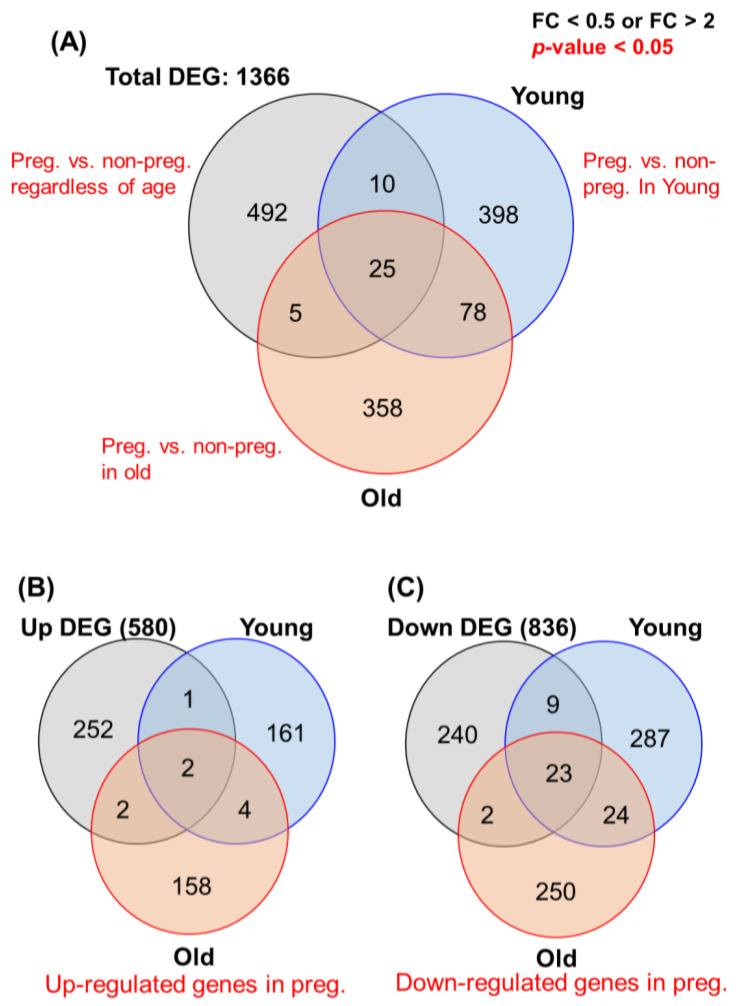
Figure 2.
Total transcriptome profiling depending on sample criteria, based on DEG analysis of NGS data. (A) Venn diagram of significantly up- or downregulated genes (fold-change ≥ 2) in the four groups (young/old, pregnancy/non-pregnancy). A total of 1366 genes were included in the RNA-seq analysis: pregnancy vs. non-pregnancy regardless of age (492 genes), pregnancy vs. non-pregnancy in the young group (398 genes), and pregnancy vs. non-pregnancy in the old group (358 genes). (B) Venn diagram of 580 upregulated genes in the pregnancy group (young and old). (C) Diagram of 836 downregulated genes in the pregnancy group (young and old). Data are presented as means ± SEM of three replicates. Significant differences are indicated by asterisks (* p < 0.05).

