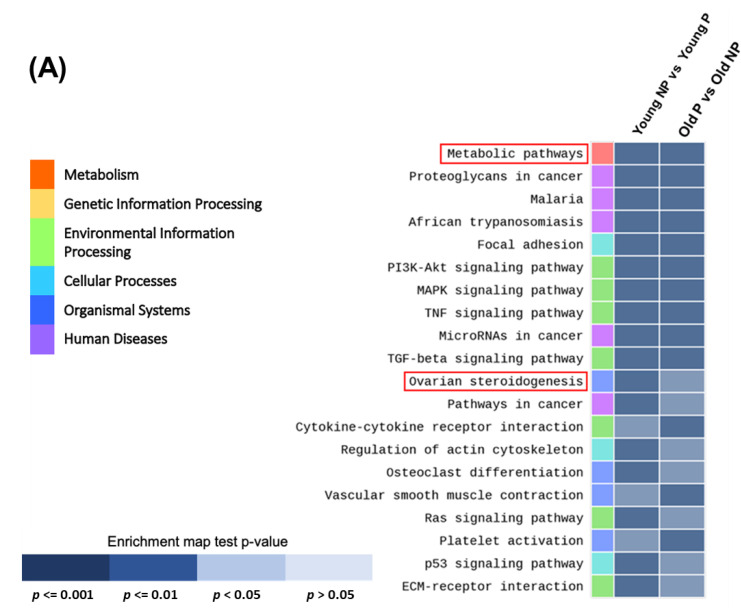
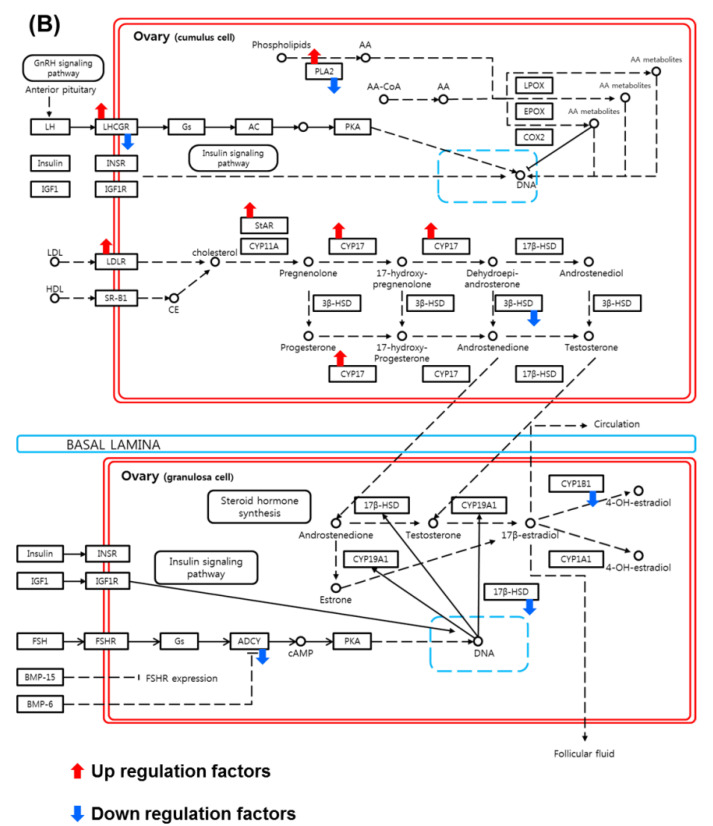
Figure 3.
Functional annotation enrichment analysis of the whole-transcriptomes profile using Database for Annotation, Visualization and Integrated Discovery (DAVID). (A) Genes were categorized by gene set enrichment analysis according to age and pregnancy. Enrichment map test p-values, p < 0.001 to >0.05. Data are presented as means ± SEM of three replicates. Significant differences are indicated by asterisks (* p < 0.05). (B) Schematic of cumulus cell signaling pathway involving up- and downregulated genes, based on the ovarian steroidogenesis KEGG pathway map from the gene set enrichment analysis.


