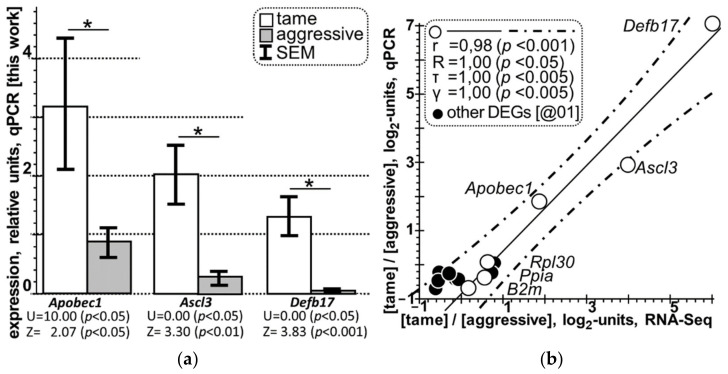
Figure 2.
Selective qPCR-based verification of the DEGs identified in this work in the hypothalamus of tame versus aggressive rats. (a) In tame rats (white bars) versus aggressive rats (grey bars), all the three DEGs examined (i.e., Ascl3, Apobec1, and Defb17) are statistically significantly overexpressed in the hypothalamus (here, bar height: mean; error bars: standard error of mean [SEM]; and asterisks (i.e., the characters "*") denote statistical significance at p < 0.05 according to both the Mann–Whitney U test and Fisher’s Z-test). (b) Statistically significant correlations between the log2 value of the three selected DEGs and three reference genes [i.e., B2m, Ppia, and Rpl30] in the hypothalamus of tame versus aggressive rats (open circles), as measured experimentally by RNA-Seq (X-axis) and qPCR (Y-axis). Solid and dash-and-dot lines denote linear regression and boundaries of its 95% confidence interval calculated by means of software package Statistica (StatsoftTM, Tulsa, OK, USA). Statistics: r, R, τ, γ, and p are coefficients of Pearson’s linear correlation, Spearman’s rank correlation, Kendall’s rank correlation, Goodman–Kruskal generalized correlation, and their p values (statistical significance), respectively. Filled circles depict the statistically significant DEGs in the hypothalamus of tame vs. aggressive rats according to the independent qPCR-based identification published elsewhere [34]. These qPCR [34] and RNA-Seq [this work] data are given in Table S1, where their Pearson’s linear correlation is statistically significant, r = 0.71 at p < 0.05 (hereinafter, see Supplementary Materials).

