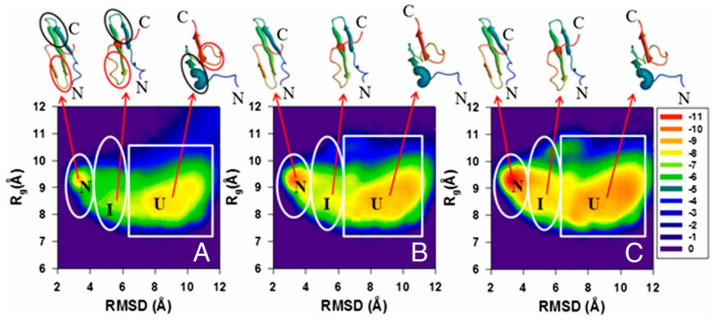
Figure 2.
Variation of the distribution of conformational states in terms of FELs (in kcal/mol) along the C-RMSD and order parameters for the wild-type FBP28 WW domain. The data have been collected from different sections of all 512 trajectory sets for the molecule (shown in (A–C), respectively). The FEL corresponding to the initial parts of the trajectories (with the average fraction of the native structures up to 20% of the maximum fraction) is shown in (A); the FEL from the middle parts of the trajectories (the fraction of the native structures between 20% and 50% of the maximum fraction) is shown in (B); and the FEL from the final parts of the trajectories (the fraction of the native structures exceeds 50% of the maximum fraction) is shown in (C), respectively. The letters “U”, “I” and “N” correspond to unfolded, intermediate and native states, respectively. The representative structures of unfolded, intermediate and native states are plotted on top of each state. Hairpin 1 and hairpin 2 are circled by black and red lines, correspondingly, in (A). Reproduced from R. Zhou et al. Proc. Natl. Acad. Sci. USA, 111, 18243–18248 (2014). Copyright 2014 National Academy of Sciences.

