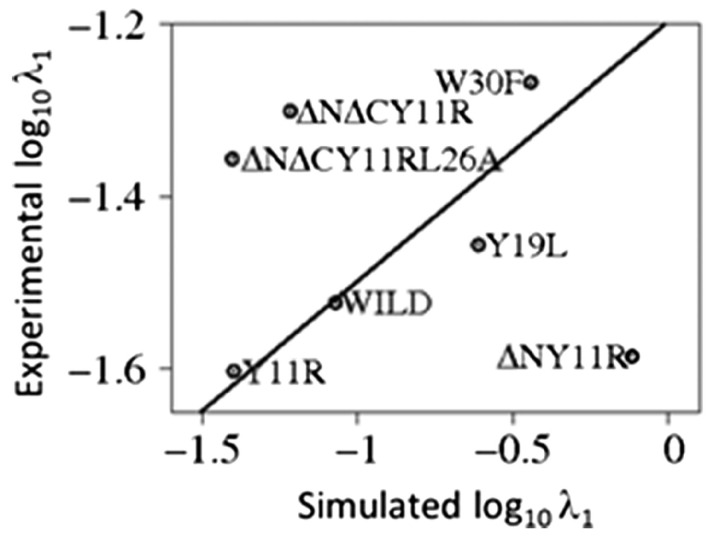
Figure 3.
A correlation plot of the experimental and simulated fast cumulative constants with a least-squares fitting line. The experimental rate constants are expressed in s, while those obtained from simulations are expressed in ns. Reproduced from R. Zhou et al. Proc. Natl. Acad. Sci. USA, 111, 18243–18248 (2014). Copyright 2014 National Academy of Sciences.

