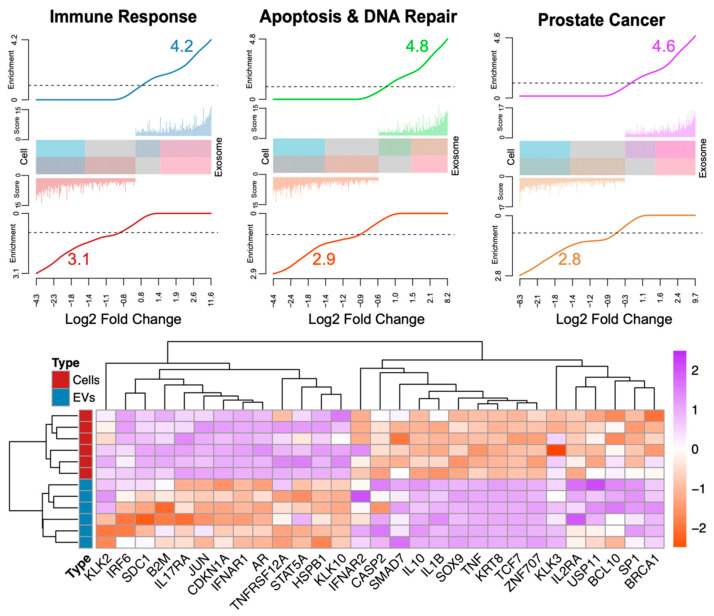
Figure 2.
Barcode plot figure [68] showing significantly higher enrichments in exosomes compared to cells associated with immune response (n = 236 transcripts), apoptosis and DNA repair (n = 200), and prostate cancer (n = 262). The barcode plot shows the log2 fold change in the X-axis. The Y-axis is composed by score (-log10 false discovery rate or adjusted p values) and enrichment (gene set-weighted density estimation). The middle bar and colored histogram in either top or bottom of the bar reflect the number of differentially expressed genes (adjusted p values < 0.05). The bottom section of the figure shows the standardized expression profiles of genes associated to the pathways showed in the top section. The data in this figure are available through Dogra et al. [37], representing the comparison between patient tissues and serum-extracted exosomes.

