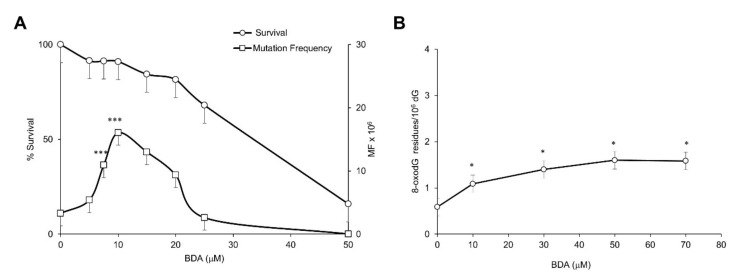
Figure 3.
Cytotoxicity, Hprt mutation frequency and DNA base oxidation induced by BDA in V79-4H cell line. (A) Cytotoxicity and Hprt mutation frequency after 3 h exposure to BDA at the indicated doses; (B) DNA 8-oxodG levels after 3 h exposure to BDA at the indicated doses as measured by HPLC/EC. Furan surviving cells are expressed as percentage of the surviving untreated cells. Mutation frequencies (MF) are calculated as described in M&M. DNA 8-oxodG levels are expressed × 106 dG. Bars indicate SD. * p < 0.05; *** p < 0.0001 by Student t-test.

