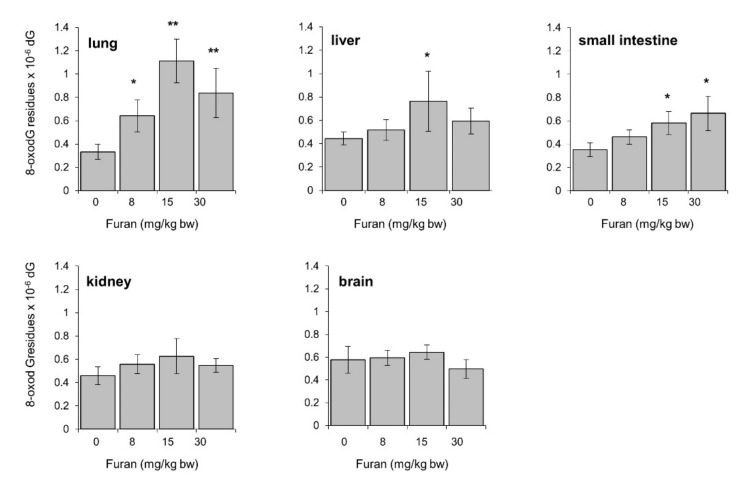
Figure 7.
Levels of 8-oxodG in lung, liver, small intestine, kidney, brain DNA in C57Bl6 mice following a 28-day oral exposure to increasing furan concentrations. The amount of 8-oxodG residues/106 dG was measured in genomic DNA by HPLC/EC (see Section 4). All values are mean +/− SE (5–11 animals/group). Asterisks indicate significant differences (* p < 0.05; ** p < 0.01 by two-tailed Student’s t-test).

