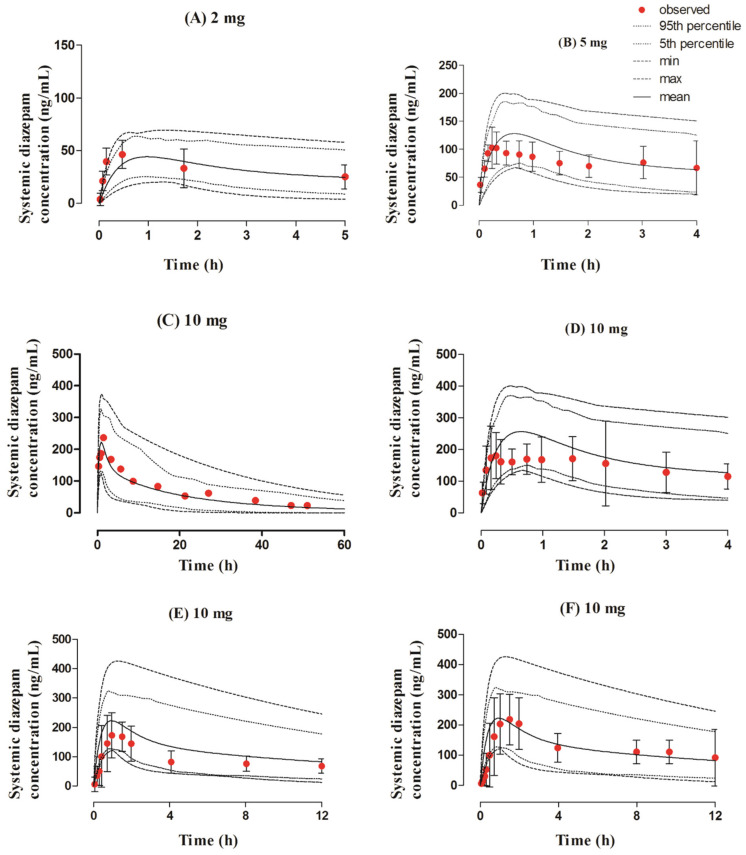
Figure 5.
Observed and predicted systemic concentration profiles of diazepam after intranasal application. The solid line (―) represents the mean value; the dotted lines (….) indicate the 5th and 95th percentiles; the dash line (---) shows the maximum and minimum predicted values; and the red filled circles (•) represent the mean observed data along with the standard deviation, where available. The figure contains systemic diazepam concentration profiles after administering intranasal doses of (A) 2 mg [46], (B) 5 mg [47], (C) 10 mg [50], (D) 10 mg [47], (E) 10 mg [48], and (F) 10 mg [48].

