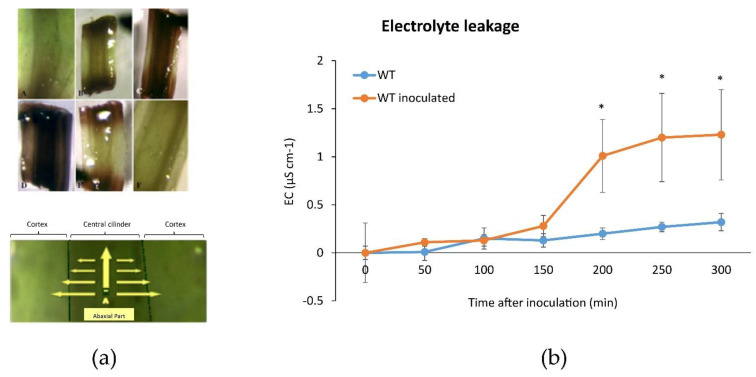
Figure 2.
Oxidative activity in inoculated pear plantlets. (a) A schematic representation of the oxidative activity in inoculated plantlets with necrotic sections in the stem (upper panel) and necrotic progression from the central cylinder to the cortex, indicated by yellow arrows in the leaf (lower panel); (b) Representative data of the electrolyte leakage of inoculated and non-inoculated Dar Gazi-wt. Electrolytic conductivity dramatically increased in plants after bacterial inoculation. Error bars represent the SD of three independent experiments, each with three biological replicates. Asterisks indicate significant differences of inoculated vs non-inoculated plants (Student’s t-test, p ≤ 0.05).

