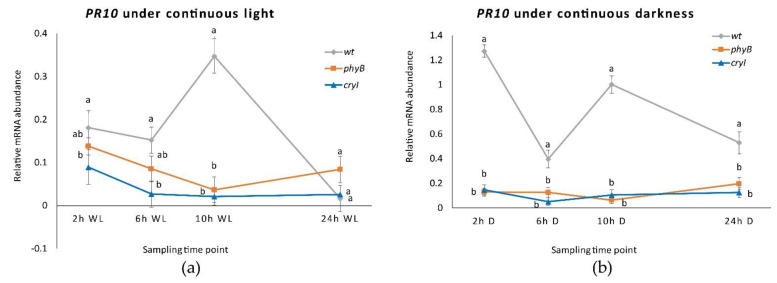
Figure 9.
PR10 expression in Dar Gazi-wt, Dar Gazi-phyB, and Dar Gazi-cry1: (a) in 24 h continuous light, panel; (b) in 24 h continuous darkness. Results are presented after normalization with ef1A. Data shown as the average of two biological replicates run in triplicate, with error bars representing SD. At each time point values with different letters significantly differ according to the analysis of the variance (ANOVA) and least significant difference (LSD) tests (p ≤ 0.05).

