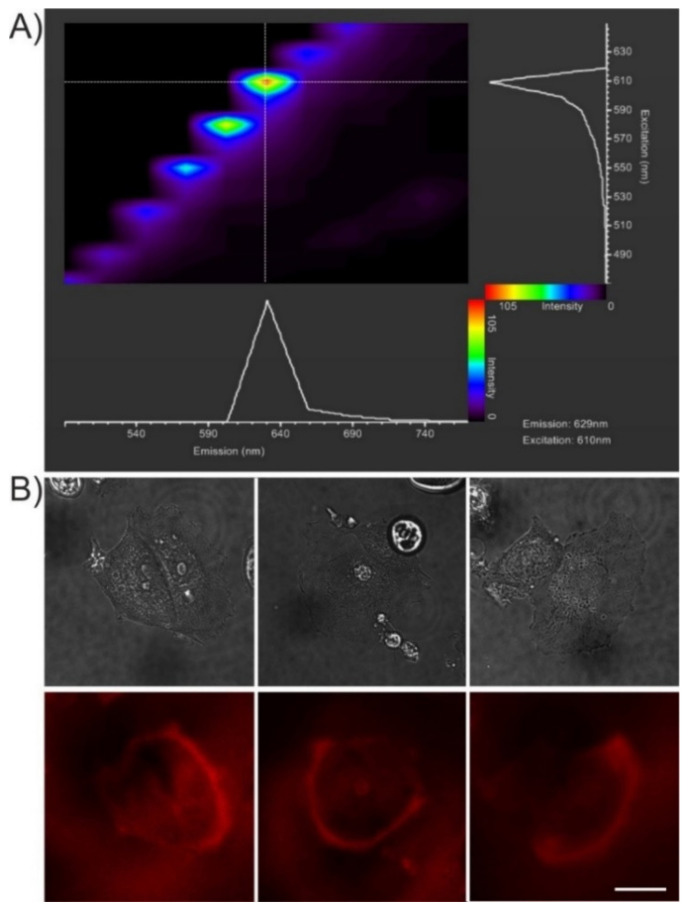
Figure 7.
(A) Microspectrofluorimetry of CQD@Arg in the visible light range. The double-lambda plot of CQD@Arg adhered to the glass surface was obtained using excitation between 470–650 nm and detecting emission of fluorescence between 490–770 nm. The maximum emission was detected using excitation at 610 nm, and those conditions were used for cell imaging. (B) Living MCF-7 cells labelled with CQD@Arg imaged by confocal microscopy in transmission (upper row) and fluorescence (lower row) channels (λexc = 610 nm; λem = 620–690 nm). Average fluorescence intensity projections of 3D stacks covering the cell thickness are shown in the fluorescence channel: scale bar, 20 μm.

