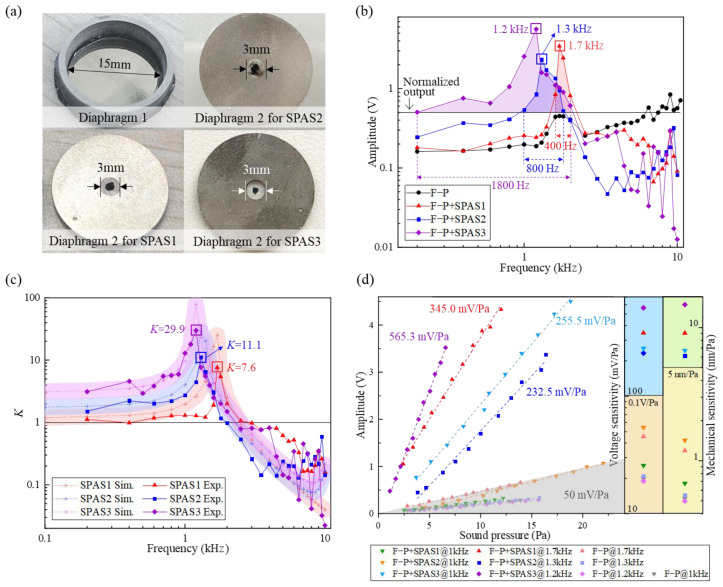
Figure 7.
(a) Diaphragms 1 and 2 for the acoustic test. (b) Measured frequency response with or without SPAS, (c) K value and (d) acoustic sensitivity for the F-P sensors with SPAS1, SPAS2, and SPAS3. Note that the black horizontal line in (b) represents the normalized output from the reference microphone.

