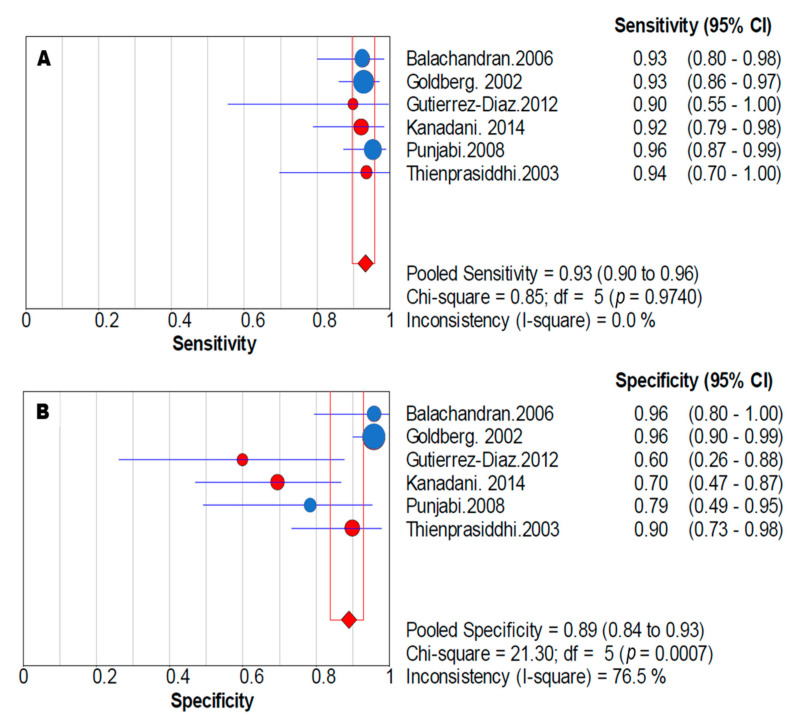
Figure 3.
Sensitivity and specificity forest plots in the meta-analysis. Forest plots of sensitivity (A) and specificity (B) corresponding to the amplitude of mfVEP to diagnose visual field defects in glaucoma. Pooled sensitivity was 0.93 (95% CI: 0.90–0.96) and pooled specificity was 0.89 (95% CI: 0.84–0.93). The size of each point is proportional to the study sample size or the weight of the study in the meta-analysis. The blue points represent studies with Accumap equipment and the red points are with Veris equipment.

