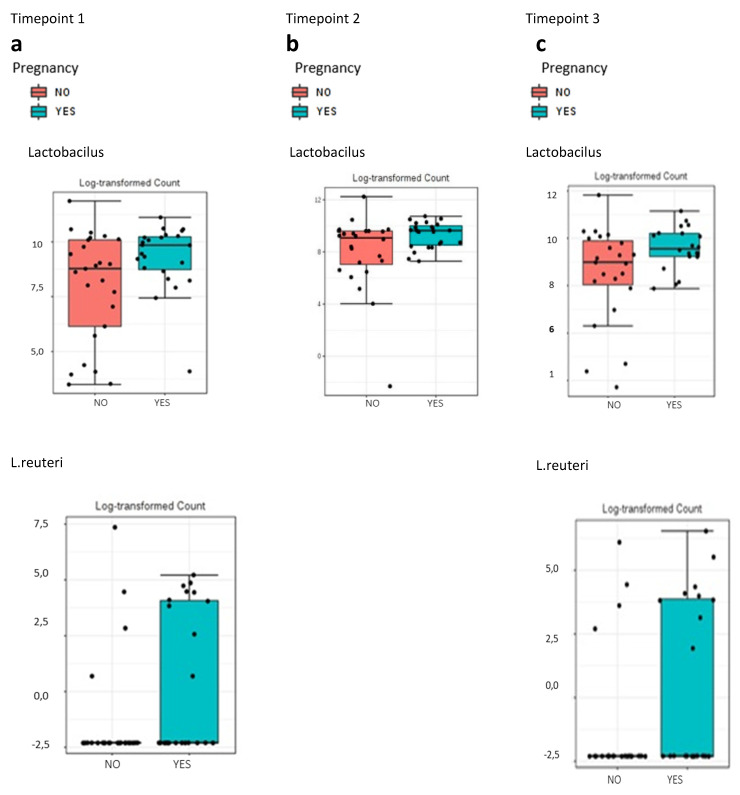
Figure 4.
Association of the vaginal samples taken at different timepoints with the gestation rate. (a) Univariate analysis represented with box plot showing relative abundance of Lactobacillus spp. (0.045) and L. reuteri (p = 0.040) for the gestation rate during the secretory phase of the cycle previous to frozen embryo transfer (days 18–22 of the cycle). (b) Univariate analysis represented with box plot showing relative abundance of the genus Lactobacillus spp. (0.027) for the gestation rate on the day of the embryo transfer. (c) Univariate analysis represented with box plot showing relative abundance of Lactobacillus spp. (p = 0.049) and L. reuteri (p = 0.059) for the gestation rate on the day of the pregnancy test.

