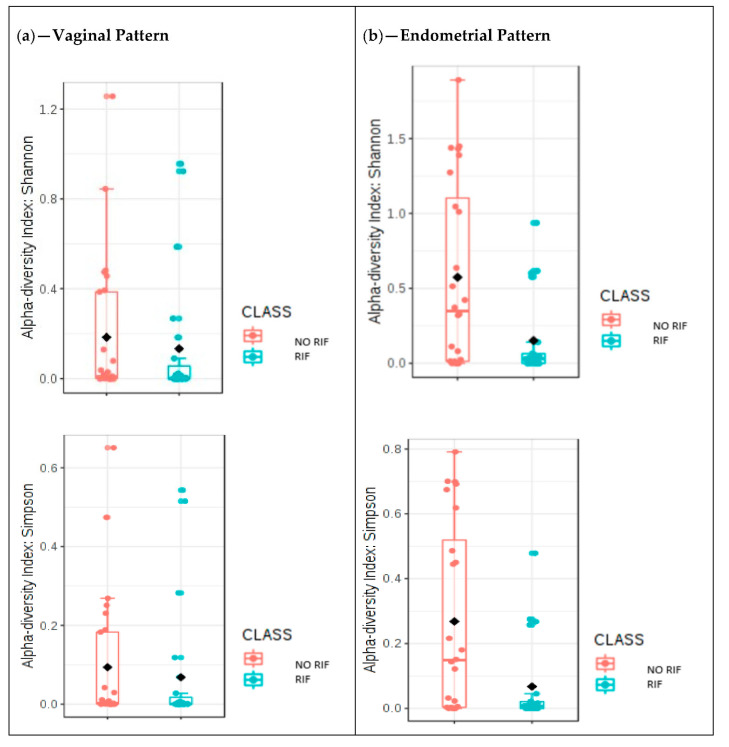
Figure 6.
Microbiome patterns by diagnosis of repeated implantation failure (RIF). (a) Comparative analysis of the Shannon diversity index (p = 0.285) and the Simpson diversity index (p = 0.276) for the women with and without RIF in relation to the study of alpha diversity. MicrobiomeAnalyst MDP. (b) Univariate analysis repre-sented with box plot showing the differences in the alpha diversity index for the study group in the en-dometrial samples. Shannon diversity index analysis, p = 0.021 and Simpson, p = 0.021; Mann-Whitney U.

