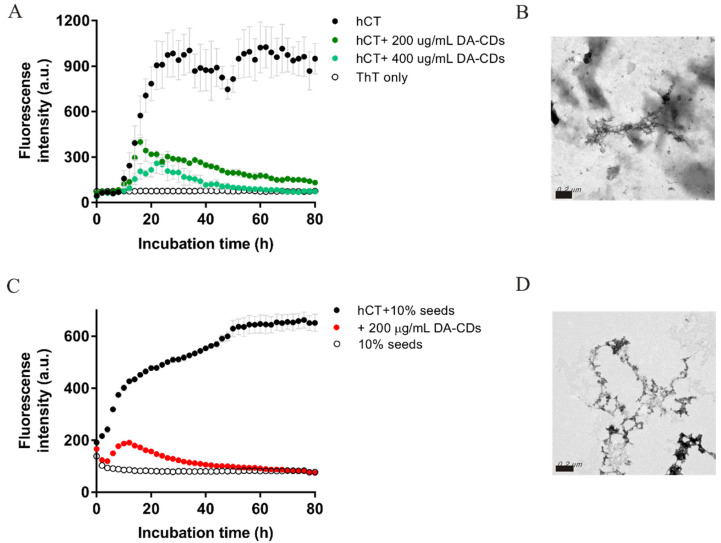
Figure 4.
ThT kinetics monitored for hCT fibrillization in the presence of (A) lipid vesicles and (B) 10% preformed hCT amyloid fibrils used as seeds. TEM images for ThT end products with 200 μg/mL DA-CDs from conditions in the presence of (C) lipid vesicles and (D) 10% seeds. Scale bar represents 200 nm.

