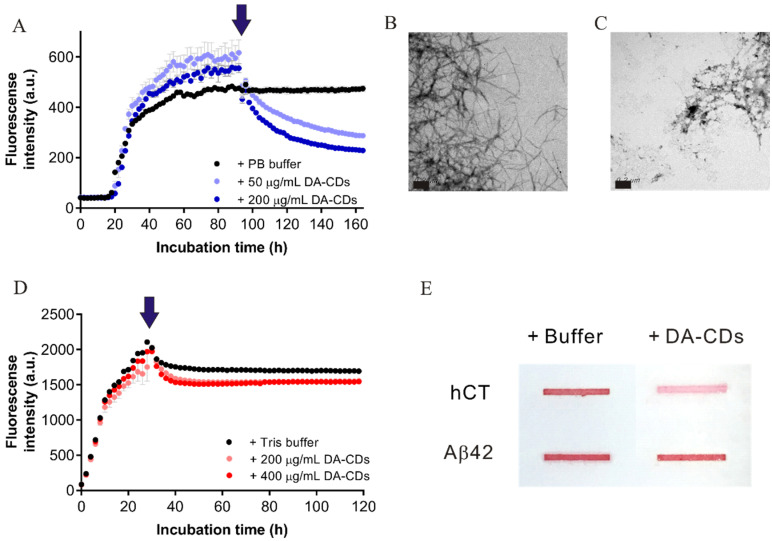
Figure 6.
The dissociating capability of DA-CDs toward different amyloidogenic proteins. (A) ThT-monitored hCT fibril dissociation by DA-CDs. (B) TEM images for ThT end products with an addition of buffer as a control study. (C) TEM images for ThT end products with the addition of 200 μg/mL DA-CDs at reaction plateau. Scale bar represents 200 nm. (D) ThT-monitored Aβ fibril dissociation by DA-CDs. (E) Slot blotting for remaining large aggregates stained by Ponceau-S.

