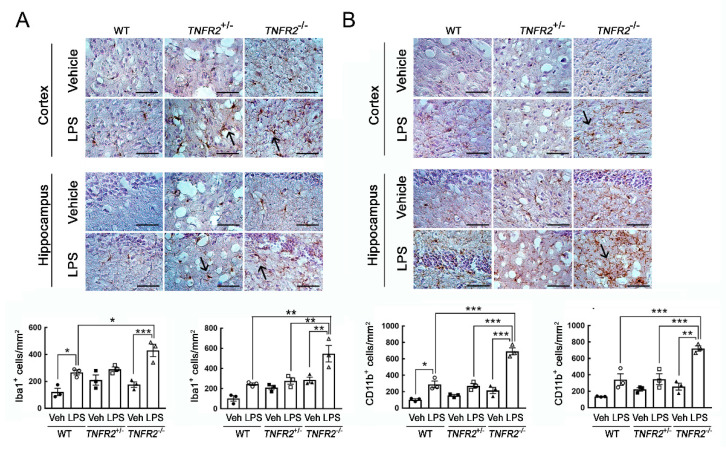
Figure 3.
An increase in Iba1+-microglia in the cortex and hippocampus of TNFR2−/− mice receiving daily peripheral LPS injection for 7 days. Brains were removed from WT, TNFR2+/−, and TNFR2−/− mice after a 7-day injection with Vehicle (Veh) or LPS (0.5 mg/kg/day). The brain tissue sections were then subjected to immunohistochemistry for Iba1 (A) or CD11b (B). Iba1+-microglia and CD11b+-microglia were quantified using NIH ImagingJ as described in the Materials and Methods. Arrows indicate Iba1+-cells (A) or CD11b+-cells (B) with the complex processes. Data shown in A and B are presented as mean ± SEM (n = 3 animals per group). One dot indicated by the different symbol (O, ●, □, ■, ▲, or △) represents an animal. * p < 0.05, ** p < 0.01, *** p < 0.001. Scale bar, 100 μm.

