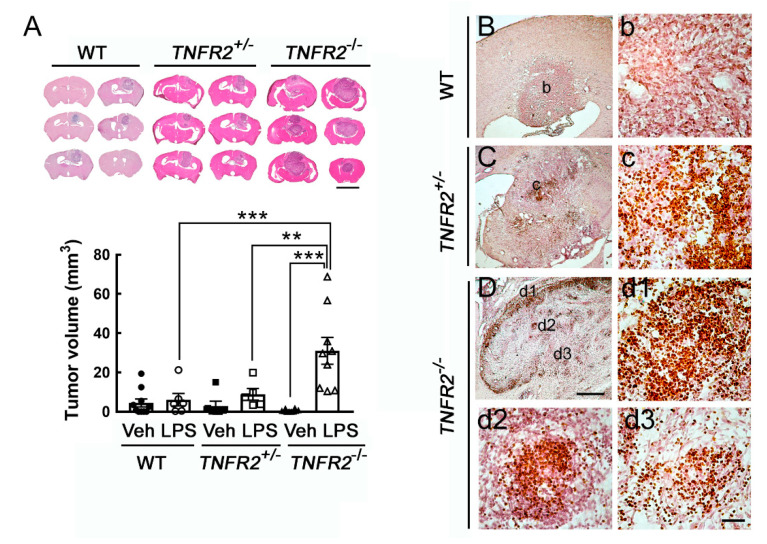
Figure 4.
Enhanced glioma growth in TNFR2−/− mice receiving repeated peripheral LPS injection for 7 days. (A). WT, TNFR2+/−, and TNFR2−/− mice were treated with Vehicle (Veh) or LPS via i.p. injection (0.5 mg/kg/day) for 7 days, and then received intracerebral administration of C6 glioma (1 × 10⁶ cells/animal) into their cortex. Animals were sacrificed on day 14 after C6 implantation, and brains were removed for tissue sectioning and H/E staining (upper panel). The tumor volume of glioma-bearing animals was quantified. Data are presented as mean ± SEM (WT-Veh = 10, WT-LPS = 6; TNFR2+/−-Veh = 6, TNFR2+/−-LPS = 5; TNFR2−/−-Veh = 5, TNFR2−/−-LPS = 9). Each symbol (●, O, ■, □, ▲, or △) represents an animal. ** p < 0.01, *** p < 0.001. (B–D). Brain tissue sections collected from glioma bearing WT (B,b), TNFR2+/− (C,c), and TNFR2−/− (D,d1–d3) mice with a 7-day LPS injection were subjected to Ki67 immunostaining. The images with a higher magnification (b,c,d1–d3) were taken from the areas indicated in (B–D). Scale bar in A, 5 mm; in (B–D), 500 μm; in (b–d), 50 μm.

