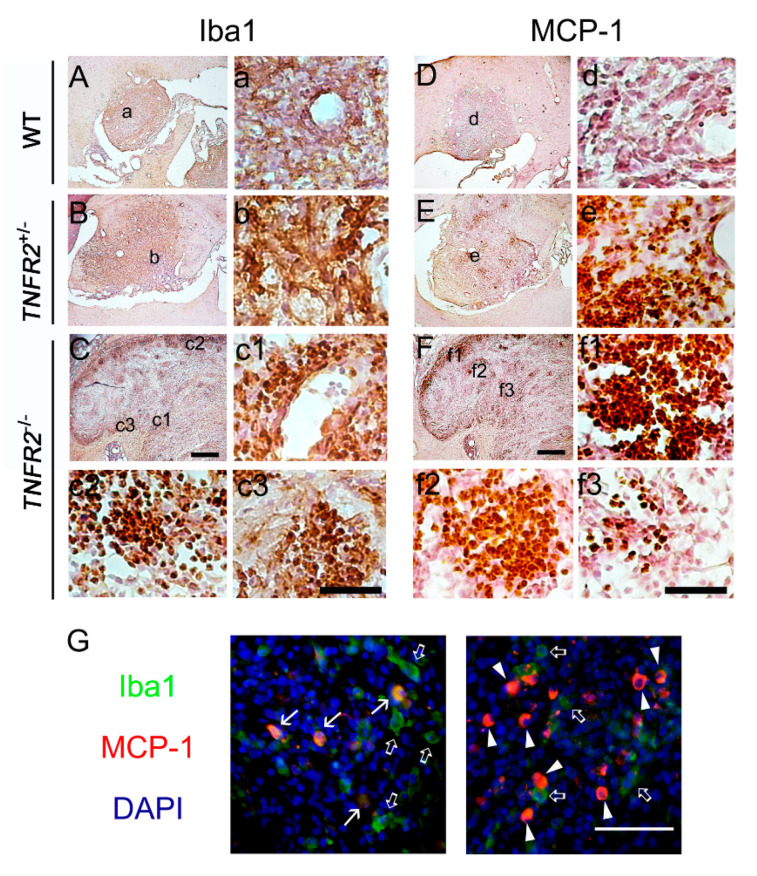
Figure 5.
Accumulation of Iba1+ microglia and MCP-1+ cells in TNFR2−/− mice receiving repeated peripheral LPS injection for 7 days. The brain tissue sections collected from glioma bearing WT (A,D), TNFR2+/−(B,E), and TNFR2−/− (C,F) mice with repeated LPS treatment for 7 days were subjected to Iba1 (A–C) or MCP-1 (D–F) immunostaining. The images with a higher magnification (a–f3) were taken from the areas indicated in (A–F). In addition, double immunofluorescence for Iba1 (green)/MIP-1α (red) was performed to examine Iba1+-microglia expressing MCP-1 (arrows) in the glioma of TNFR2−/− mice receiving a 7-day injection with LPS (0.5 mg/kg/day). Open arrows and arrowheads indicate Iba1+/MCP-1− cells and Iba1−/MCP-1+ cells, respectively. The tissues were also subjected to DAPI nuclear counterstaining (blue). Scale bar in (A–F), 500 μm; in (a–f) and (G), 50 μm.

