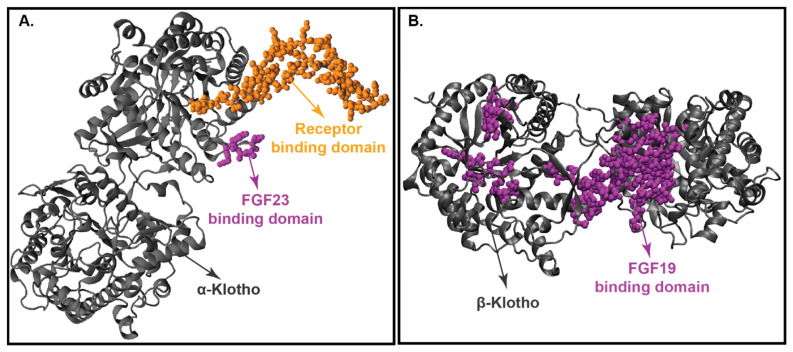
Figure 5.
Crystal structure of klotho proteins. (Panel-A): Crystal structure of KLA. (Panel-B): Crystal structure of KLB. Both KLA and KLB’s backbone is represented in grey, protein binding domain (FGF23 for KLA and FGF19 for KLB) shown in magenta, and receptor binding domain is represented in yellow.

