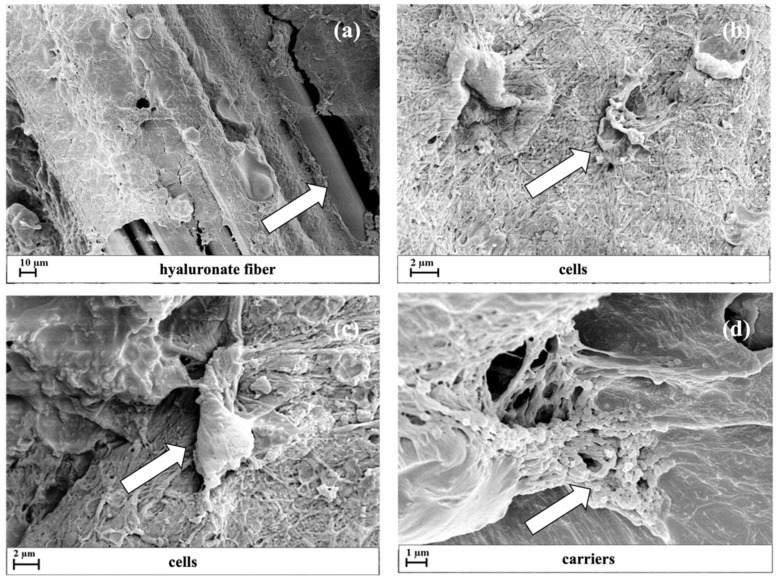
Figure 4.
3D scaffold structure monitored by FE-SEM images after its assembly. FE-SEM images were reported with different enlargements to better describe: the hyaluronate fibers covered by the fibrin hydrogel (a); the cells (see arrowheads) entrapped within the fibrin matrix in large aggregates connected with fibrin network (b,c); NCs distributed within the fibrin network (d).

