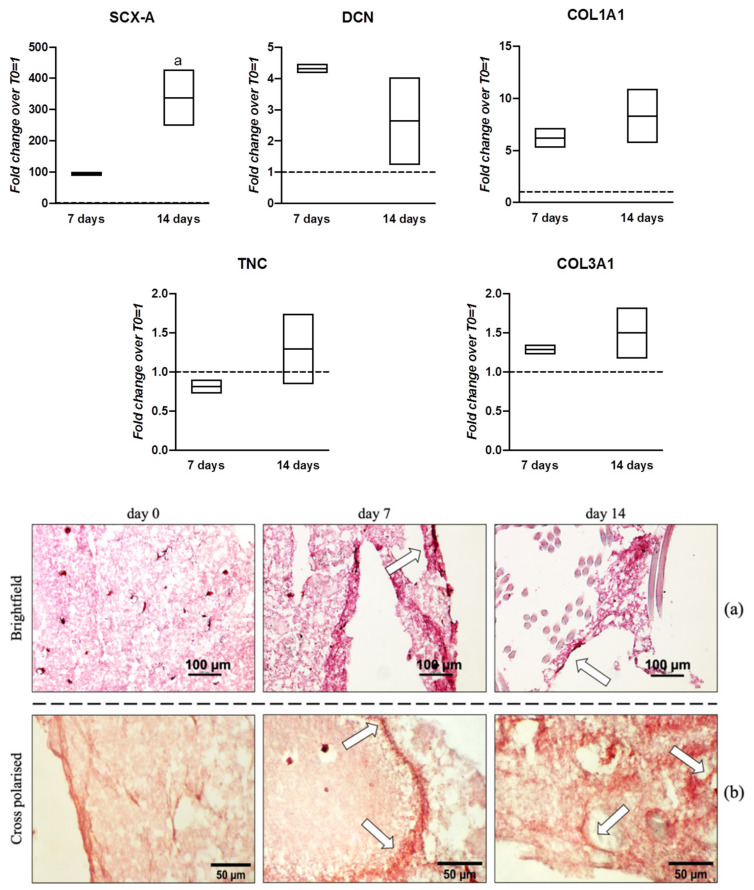
Figure 7.
Gene expression profiles for tenogenic markers and histological characterization of hWJ-MSCs cultured within 3D construct functionalized with PLGA-NCs for hGDF-5 controlled delivery under cyclic strain. hWJ-MSCs were cultured into the 3D microenvironment for up to 14 days. The mRNA levels of different tenogenic markers (COL1A1, SCX-A, DCN, TNC, and COL3A1) were monitored. Relative quantification of each mRNA gene expression normalized to endogenous GAPDH (internal control) was calculated using the 2−ΔΔCt method and presented as fold change over hWJ-MSCs T0 = 1 (dashed line). Statistically significant differences are shown as “a” = p ≤ 0.05 compared to T0; n = 2 (biological replicates). Samples at same time-points were subjected to Sirius Red staining for collagen highlighting. The homogenous network of synthetic fibrin matrix appeared progressively filled with new areas of matrix stained in darker red suggesting collagen deposition (arrowheads, a). Polarized microscope revealed larger areas of birefringent collagen fibers (arrowheads, b).

