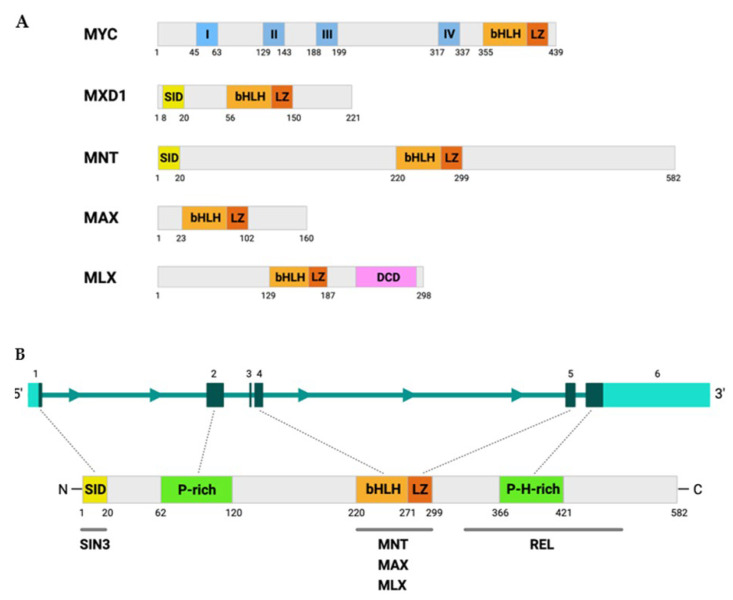
Figure 1.
MNT and MYC protein structure. (A) Comparison between MYC, MXD1, MNT, MAX, and MLX protein sizes and domains. The canonical isoforms are shown; specifically, the p22 isoform for MAX and the gamma isoform for MLX. MYC boxes are represented in blue with the numbers I–IV. (B) The MNT gene structure is schematized at the top, with boxes representing the six exons, and a scheme of the MNT protein at the bottom. The MNT exons that encode the most important regions are indicated as boxes, and the dotted lines connect the exons with the corresponding protein domains. The main MNT-interacting proteins are shown at the bottom. SID: SIN3 interacting domain; P-rich: proline-rich sequence; bHLH: basic helix–loop–helix; LZ: leucine zipper; P-H-rich: proline and histidine-rich region; DCD: dimerization and cytoplasmic localization domain. Figures were created with BioRender.com (Toronto, ON, Canada).

