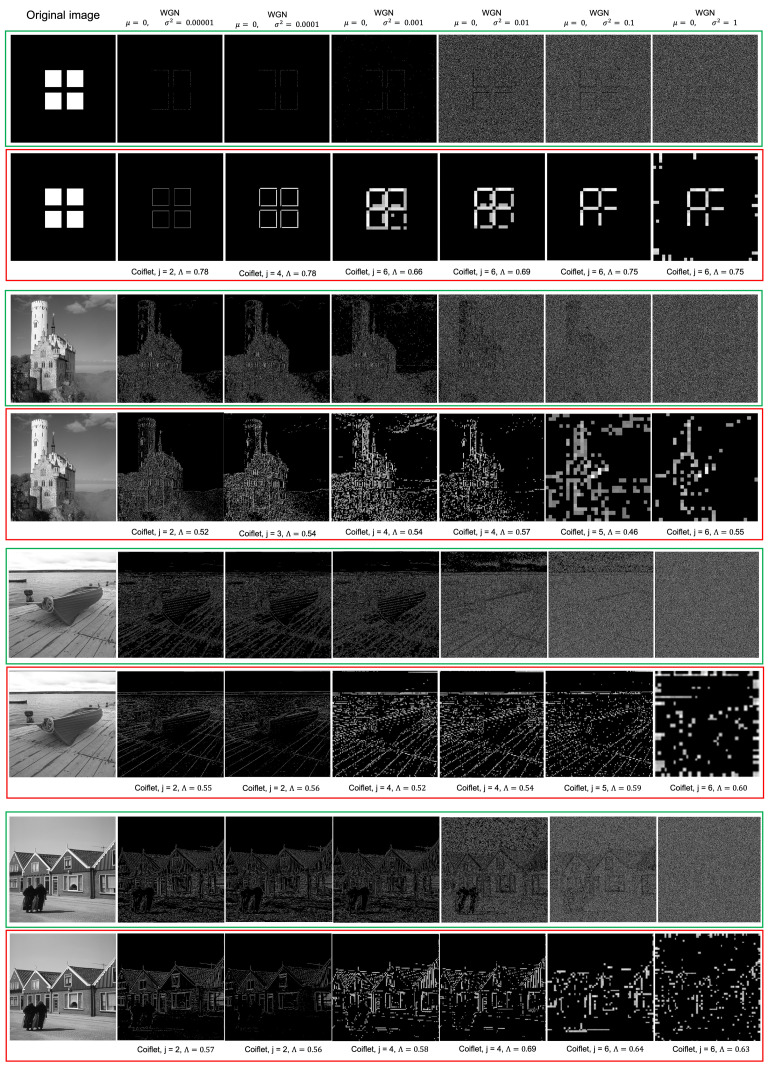
Figure 11.
The original image is shown in the first column of the image grid. Other columns correspond to different noise levels. The first, third, fifth, and seventh rows correspond to Canny processed images (grouped in green) and the second, fourth, sixth and eighth rows correspond to LRWEEDA processed images (grouped in red). The corresponding LRWEEDA parameters are shown below the images of red groups. The LRWEEDA processed output images sizes are 483 × 483 pixels when ; 244 × 244 pixels when ; 124 × 124 pixels when ; 64 × 64 pixels when and 34 × 34 pixels when .

