Figure 4.
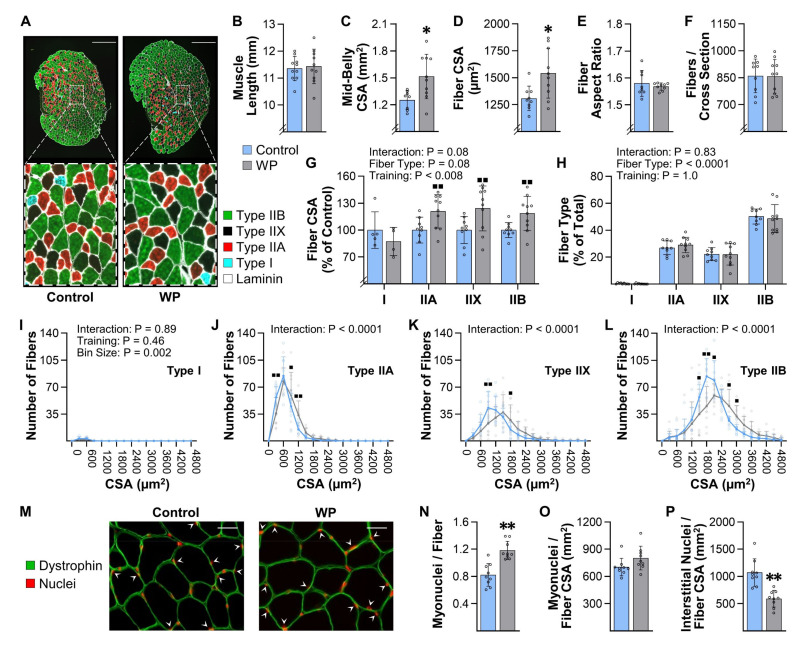
WP induces hypertrophy and myonuclear accretion in the plantaris. Plantaris muscles were collected from mice that had completed 13 weeks of training with weighted pulling (WP) or the unweighted (control) paradigm: (A) representative mid-belly cross-sections from samples that had been subjected to immunohistochemistry (IHC) for laminin and fiber type identification (i.e., Type I, IIA, IIX, or IIB); (B) prior to the IHC analyses, the resting length of the plantaris muscles from both the right and left leg of each animal was measured, and then the average for the pair was recorded; (C–L) one muscle from each animal was subjected to IHC as described in (A), and then the entire cross-section was analyzed to determine the (C) mid-belly cross-sectional area (CSA), (D) average CSA of the fibers, (E) average aspect ratio (i.e., max ferret diameter/min ferret diameter) of the fibers, and (F) the total number of fibers in the cross-section. The same images were also used to determine the effect of WP on the (G) relative CSA of the individual fiber types, and (H) proportion of the fibers that were represented by the different fiber types; (I–L) frequency histograms that display the number of fibers from each muscle that had the indicated fiber CSA; (M) representative mid-belly cross-sections from plantaris muscles that were subjected to IHC for dystrophin (to identify the outer boundary of the muscle fibers) and Hoechst (to identify nuclei). Images of the entire cross-section were analyzed to determine the (N) myonuclei to fiber ratio (i.e., the total number of nuclei within the muscle fibers/total number of muscle fibers), (O) the myonuclei to fiber CSA ratio (i.e., the total number of myonuclei/total CSA occupied by the muscle fibers), and (P) the interstitial nuclei to fiber CSA ratio (i.e., the total number of interstitial nuclei/total CSA occupied by the muscle fibers). All data are presented as the group mean ± SD, with individual data points displayed as hollow symbols (n = 9–10/group, except for the Type I fibers in G, which only had detectable Type I fibers in four to five of the muscles/group). The results in B–F and N–P were analyzed with unpaired t-tests, and the results in G–L were analyzed with two-way ANOVA followed by multiple post hoc comparisons that were FDR corrected with the two-stage step-up method of Benjamini, Krieger, and Yekutieli. The insets in G–L indicate the p-value for the main effects and/or interaction. Significantly different from the condition-matched control group, * p < 0.05, ** p < 0.0005, ■ q < 0.05, ■■ q < 0.005. Scale bar in A = 500 µm, scale bar in M = 25 µm, arrows in M point to myonuclei.

