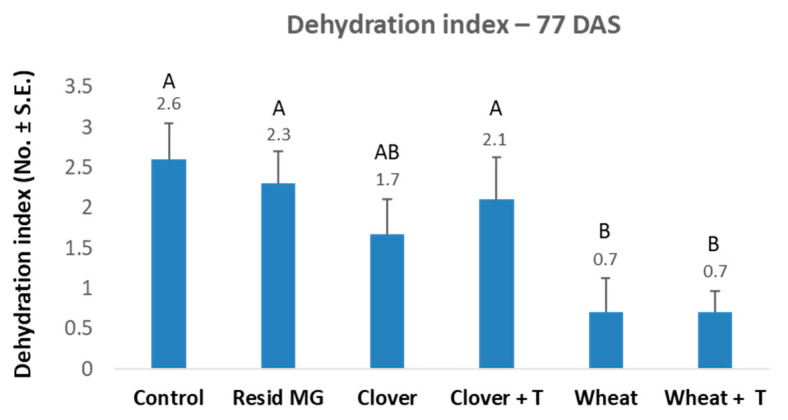
Figure 3.
The 2019 soil microbiome integrity experiment–dehydration assessment at the experiment’s end (77 DAS). The experiment is described in Figure 1. The controls included the same prior crop soil but with tillage (+T) or soil that had not been cropped before the maize growth (control). Additionally, similar control with commercial Resid MG product (Arbuscular mycorrhizal, Glomus iranicum var. tenuihypharum) was tested. Wilt assessment was based on four categories related to the whole plant: healthy (1), minor symptoms (2), dehydrated (3), and dead (4). Vertical upper bars represent the standard error of the mean of 10 replications. Statistically significant (one-way ANOVA, p < 0.05) differences between treatments at the same measures are indicated by different letters (A–B).

