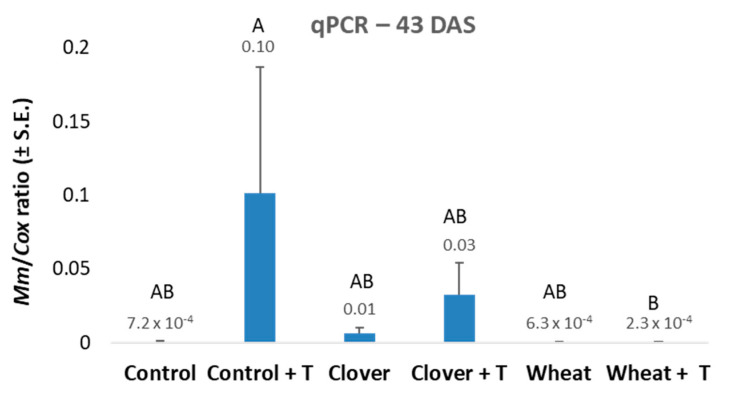
Figure 5.
The 2020 commercial fields soil experiment—real-time PCR analysis 43 DAS. The experiment is described in Figure 2. The y-axis indicates M. maydis relative DNA abundance in the roots normalized to cytochrome c oxidase (COX) DNA. Values indicate an average of 10–12 replications. Error bars indicate standard error.

