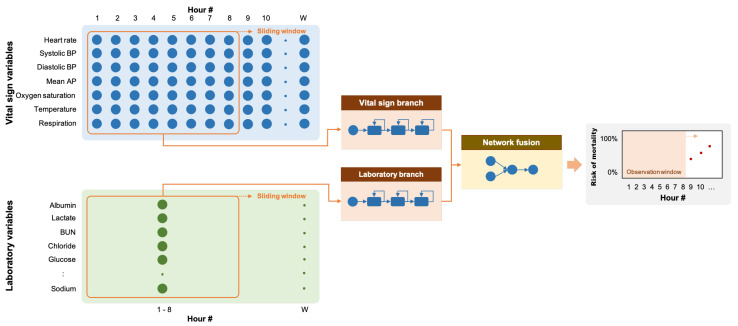
Figure 2.
Diagram of our RNN model with two input branches for vital signs and laboratory variables, respectively. Each branch consists of three recurrent layers, and the resulting feature maps were fused with two fully connected layers. The network ends with a sigmoid layer for estimating a risk of mortality from 0 to 1.

