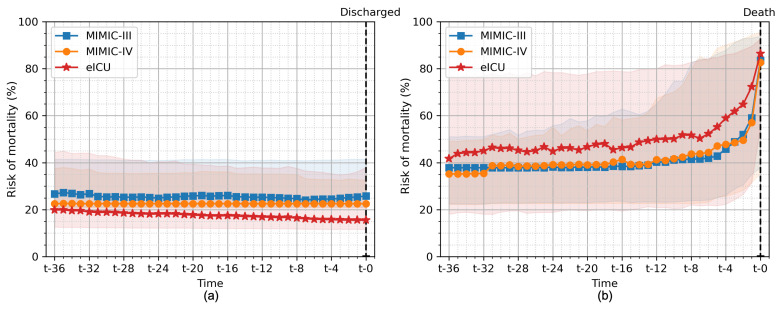
Figure 9.
The risk of mortality calculated for all patients in the hold-out test set for (a) those patients who survived their ICU stay and (b) those patients who subsequently died during their ICU stay. The line plots show the median, and the shaded areas show the 25th and 75th quartiles of risk of mortality bootstrapped from all cross-validation folds. Among the surviving patients, the risk of mortality was low and tended to decrease until discharge. In contrast, among patients who died during their stay, the risk of mortality was high and increased until the patient’s death. A sharp increase in the risk of mortality was observed eight hours before death.

