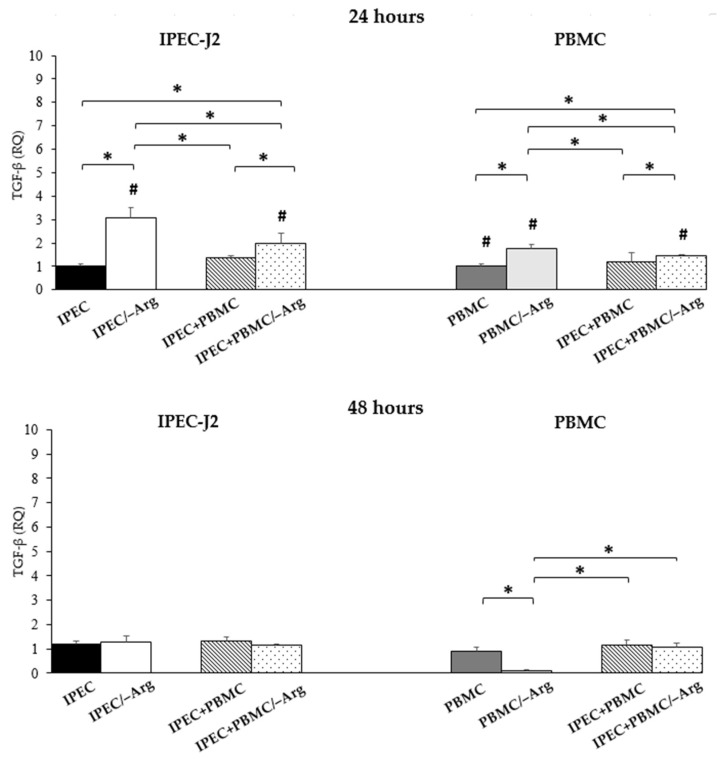
Figure 8.
Transforming Growth Factor-β (TGF-β) gene expression in IPEC-J2 cells and in PBMC at 24 and 48 h of incubation. Each value represents the mean ± SE of 8 replicates of 6 independent experiments. Significant differences (p < 0.05) among groups (upon row comparisons within paired groups) are indicated with asterisks. Significant differences (p < 0.05) between 24 and 48 h in the same group (upon column comparisons vs. respective control group) are indicated with hashtags. Data were analysed according to the 2−ΔΔCt method, in which the expression levels of each cytokine, normalized to the GAPDH cDNA amount, were expressed as relative quantities (RQ).

