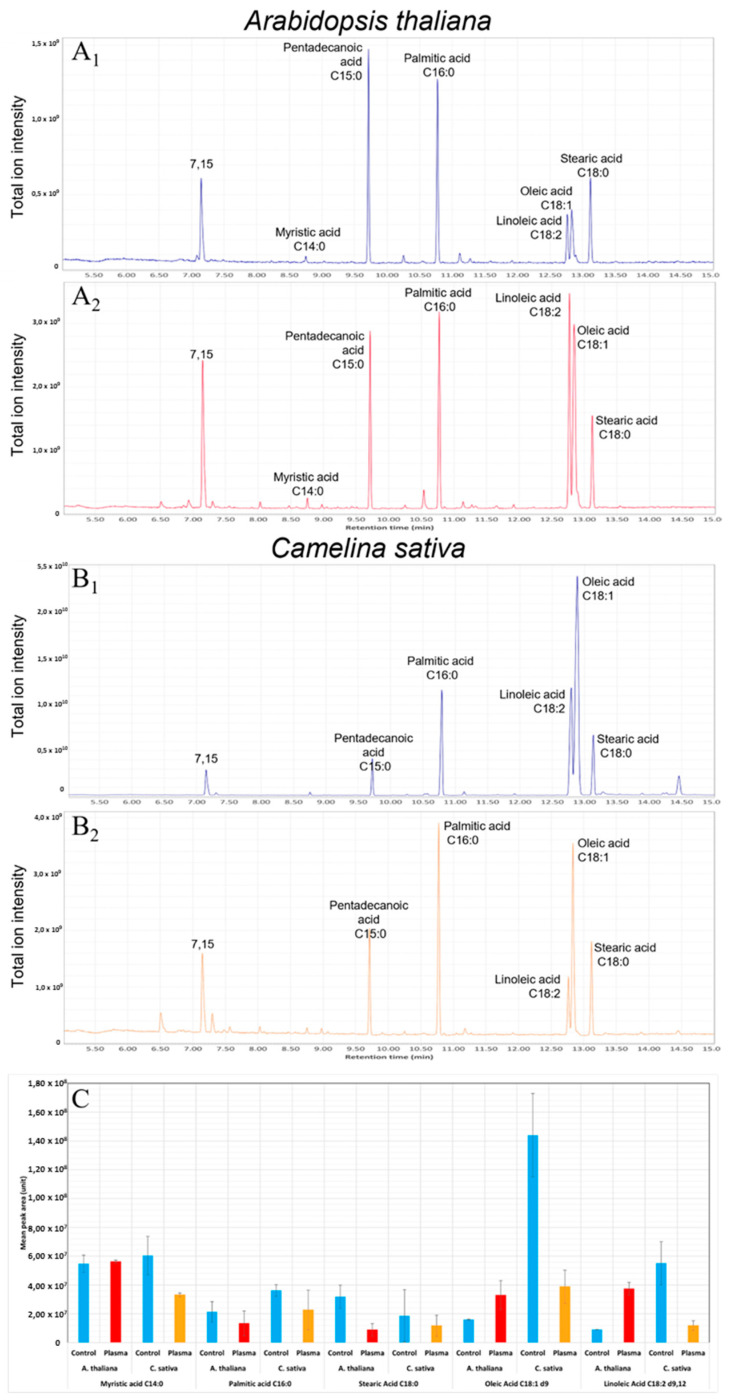
Figure 6.
Change of free fatty acid composition on the surface of A. thaliana and C. sativa in the case of the control, the plasma seeds treated 1 min (C. sativa) and 15 min (A. thaliana). In blue, the analysis of the control seeds, in red, the treated A. thaliana seeds, and in orange, the treated C. sativa seeds. (A) GC/MS spectra of A. thaliana extract, (A1) control seeds, (A2) 15 min plasma treated seeds. (B) GC/MS spectra of C. sativa extract, (B1) control seeds, (B2) 1 min plasma treated seeds. (C) analysis of three samples, the relative abundance is calculated as a function of the C15 proportion used as a standard. All unsaturation places are noted as follows: “d”.

