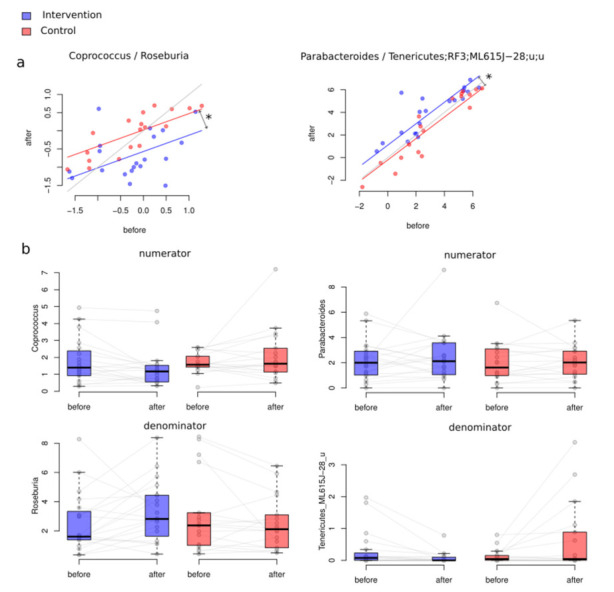
Figure 5.

(a) Between-group differential abundance analysis results. Significantly changed balance values before and after the intervention in both the control and the intervention groups. Figure interpretation is as follows: There is one point per participant. If the point is under the grey line, for the participant, the balance decreased. If the point is above the line, the balance increased. Asterisks denote significant associations (FDR < 0.05). (b) The relative abundance of the taxa included in numerators and denominators of significantly changed balances (%). If we consider these relative abundances, it can be suggested that the main impact in the second balance was provided by unclassified Tenericutes.
