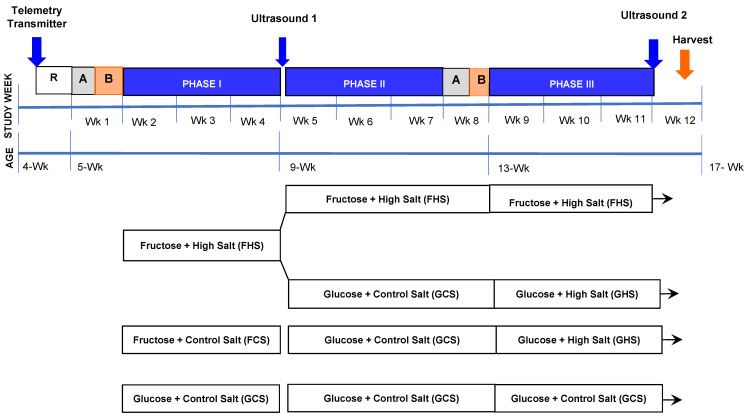
Figure 1.
Schematic of the Timeline of Experimental Protocols and Study Phases. Rat age and study week are depicted across the timeline. R, recovery period; A, acclimation to metabolic cages; B, baseline. Surgery for telemetry transmitter placement and ultrasound studies are as indicated. Groups are subsequently depicted by their sugar-salt intake in Phases I and III.

