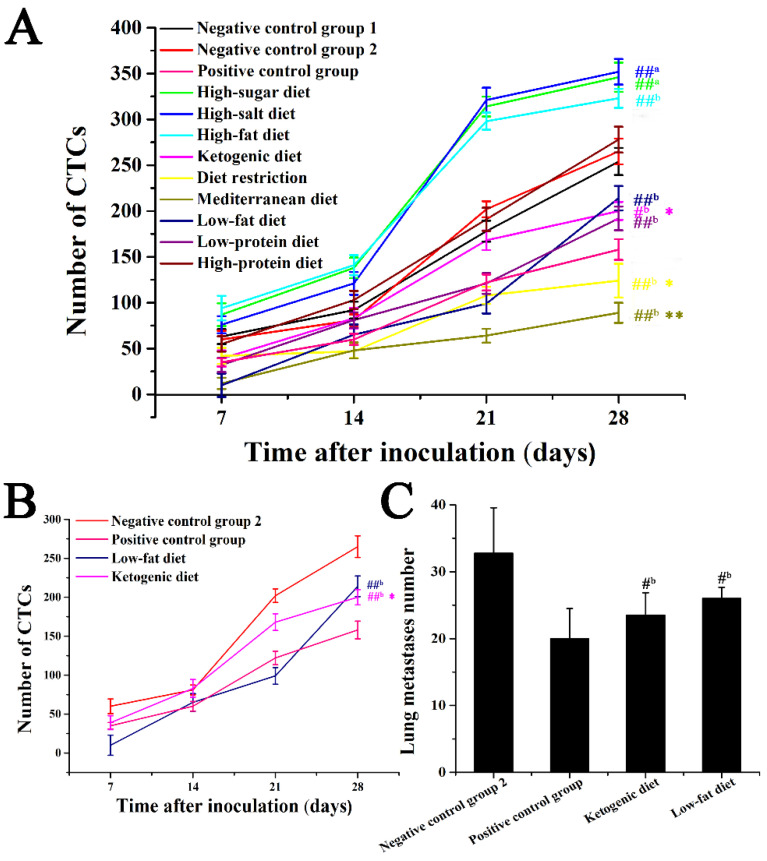
Figure 5.
Effect of different dietary patterns on CTC numbers. (A) CTC numbers of different dietary patterns during cancer progression. (B) CTC numbers of Mediterranean diet group and high-salt diet group during cancer progression. (C) Numbers of lung metastatic cancers of Mediterranean diet group and high-salt diet group during cancer progression. ##a p < 0.01 compared with that of negative control group 1. #b p < 0.05 and ##b p < 0.01 compared with that of negative control group 2. * p < 0.05 and ** p < 0.01 compared with that of positive control group.

