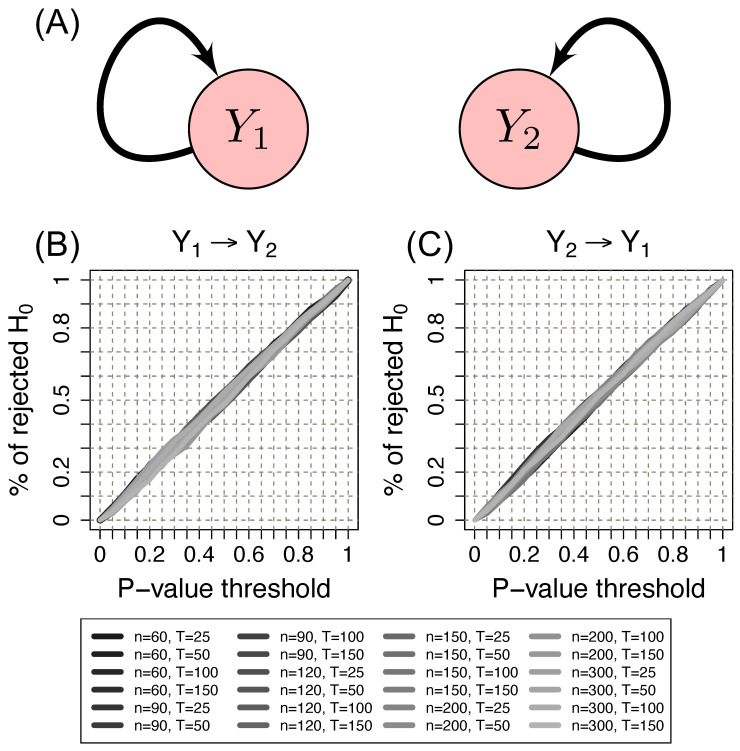
Figure 2.
(A) Schema of scenario 1. Two time series of Erdös–Rényi random graphs ( and ) without G-causality between them. (B) ROC curve to evaluate the control of the type I error from to . (C) ROC curve to evaluate the control of the type I error from to . The x-axis represents the p-value threshold. The y-axis represents the proportion of rejected null hypotheses given a p-value threshold. n: the number of vertices. T: the time series length. Note that the proportion of identified Granger causalities under the null hypothesis is as expected by the p-value threshold (ROC curves lie at the diagonal). Therefore the proposed method indeed controls the type I error.

