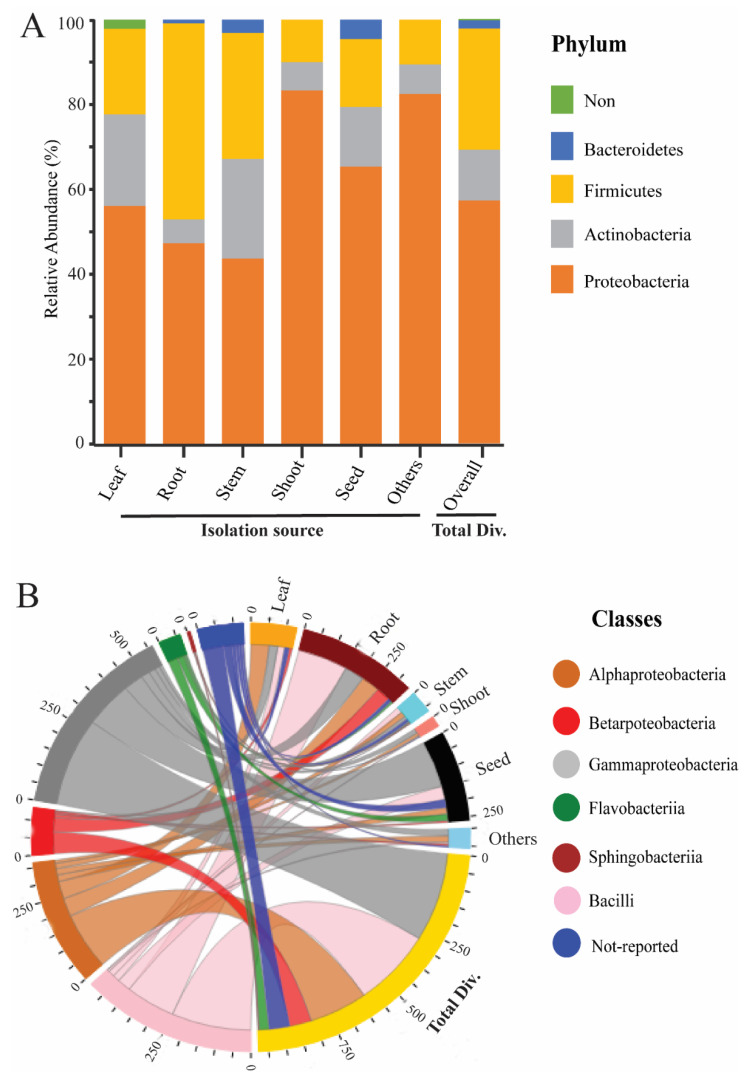
Figure 2.
Relative abundance of rice endophytic bacteria diversity within rice tissues. (A) Endophytic bacteria diversity at the phylum level; the isolation sources were plotted on the horizontal axis, and relative percentage of phyla is visualized by the vertical axis, each taxon showed with specified color in stacked columns. (B) 3D chord diagram illustrates the rice endophytic bacteria diversity at the class level; each arc shows overlapping diversity within rice tissues; 3D visualization available on following link https://beta.rstudioconnect.com/connect/#/apps/42c60c75-8ff2-4dce-ad48-c1446c8ccb55/access, accessed on 5 September 2021 Total Div.: presenting the total diversity within rice tissues (leaf, root, stem, shoot, seed, and including other sources). Other: including isolation sources of rice (grain filling, tillage stages, and also not-conformed sources).

