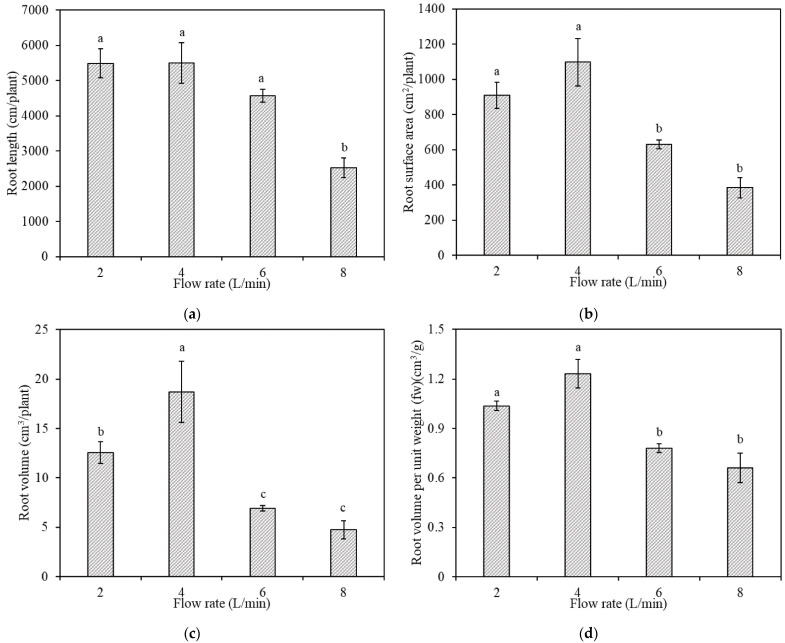
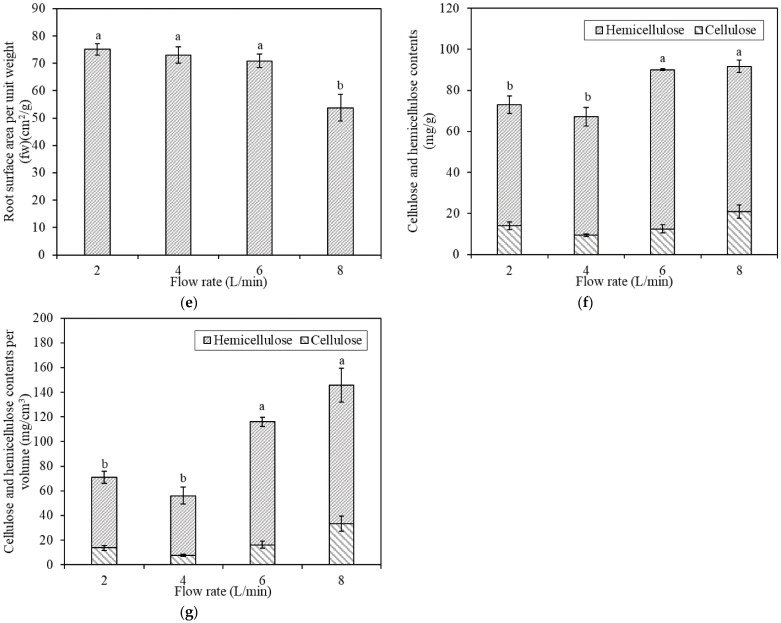
Figure 2.
Morphology and cell wall composition of roots under different flow rates, as measured by (a) root length; (b) root surface area; (c) root volume; (d) root volume per unit weight; (e) root surface per unit weight; (f) cellulose and hemicellulose contents per unit fresh weight; and (g) cellulose and hemicellulose contents per unit volume. Bars labeled with different letters differ significantly (p < 0.05). Data are expressed as means ± standard error (n = 4).


